In step 6, select the parts of the model to use in the fatigue calculation, and set some of the advanced calculation options.
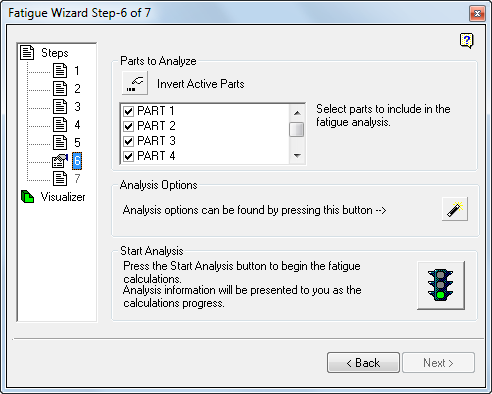
Parts to Analyze
In Step 6, you specify which parts to include in your fatigue analysis. You can perform the fatigue calculation on all parts or a subset of the parts in the model.
- Deselect the parts that you want to exclude from the fatigue analysis by deactivating the appropriate checkboxes.
- You can invert the inclusion state of all parts in a single click using the Invert Active Parts button.
When you exclude parts from the fatigue calculation, the result for the nodes in these parts is automatically set to infinite life. It is critical that you verify there are no potentially critical areas within the excluded parts.
Analysis Options
The design of Fatigue Wizard is meant to help you perform efficient fatigue analyses. If you have little experience, use the defaults for certain analysis options, which are suitable for a general purpose, time-efficient analysis.
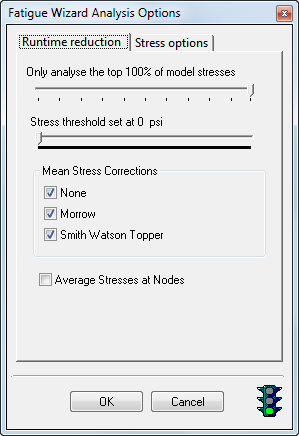
If you are experienced, change these defaults to better suit the fatigue analysis and to improve the overall accuracy of the predicted fatigue results. Click the Analysis options button (  ) to access the Runtime reduction tab of the Analysis Options dialog box:
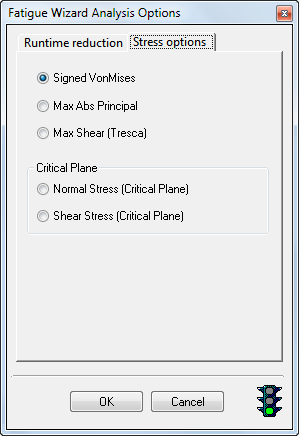
Click the Stress options tab to see the following settings:
The analysis options provide control of:
- Analysis filter (slider) – Only analyze the top xx% of model stresses
- Stress threshold (slider)
- Mean Stress Corrections (for fatigue life analyses only)
- Use Average Stresses at Nodes option
- Selection of stresses used in the fatigue calculation (Von Mises, Principal, or Shear)
- Selection of Critical Plane (Normal or Shear)
Analysis Filter
Runtimes for performing fatigue calculations on large models, or smaller models with complex load histories, can be lengthy. If run times are excessively long, you can reduce the run times.
- Drag this slider towards the left, which automatically selects only a defined percentage of the nodes for fatigue processing.
The selection of this top percentage of nodes is based on the maximum nodal stress range seen in the stress history.
When you use the analysis filter, all nodes that fall outside of the specified stress range are assigned infinite life.
Mean Stress Corrections (for Life Calculations only)
By default Fatigue Wizard calculates result sets using three approaches to account for mean stresses. If you do not require calculation of one or more of these methods, switch them off in the analysis options form to shorten the run time.
A Strain Based Fatigue Life (EN) calculation uses:
- No Mean Stress Effect
- Morrow Correction
- Smith-Watson-Topper Correction
A Stress Based Fatigue Life (SN) calculation uses:
- No Mean Stress Effect
- Gerber Correction
- Goodman Correction
Further details on these mean stress correction methods are available in the theory sections of the Fatigue Wizard Help.
Average Stresses at Nodes option
When this option is activated, the average (or smoothed) stress values at each node are used as the basis of the fatigue calculation. Sometimes poor stress precision or stress singularities (highly localized exaggerated stresses) exist within a model due poor local mesh quality (for example, from badly distorted elements). Using the average stresses for the fatigue analysis will help to prevent overestimating the amount of fatigue damage caused by the stress cycles.
Fatigue Safety Factor Calculation Methods
If you elect to perform a fatigue safety factor (FSF) calculation, by default, Fatigue Wizard uses two different methods to calculate the FSF from the Goodman or Haigh diagram.
- Constant R (stress ratio)
- Constant Mean
Results of both of these calculation methods are output for all FSF analyses. Unlike the Mean Stress Correction options for life analyses, there are no analysis options to disable either of the FSF calculation methods. Further details regarding these calculation methods are available in the Fatigue Safety Factor page within the Theoretical Overview section of the Fatigue Wizard help.
Stress Options
The Fatigue Wizard software takes linear stress results from an FEA analysis to calculate the fatigue results. Within the analysis options, you can specify how Fatigue Wizard utilizes these stress results. By default (general case) Fatigue Wizard utilizes the signed Von Mises approach. In some situations, this method introduces errors to the calculation because no account is taken of the change in direction of principal stresses. If you suspect this situation, select one of the Critical Plane methods.
The following are the stress values you can select and use in the fatigue calculation.
- Signed Von Mises
- Max Abs Principal Stress
- Max Shear (Tresca)
- Critical Plane (Normal Stress)
- Critical Plane (Shear Stress)
You determine which stress value is most appropriate for the calculation. However, some stress types are not available for strain-based analyses. Stress types are unavailable (grayed-out) if they are not applicable to the current analysis.
If you select either of the Critical Plane approaches, you increase solution times significantly. The cause of the increase is the resolution of stress tensors into many planes (18 by default). A separate fatigue calculation runs on each of these planes.
For details of the stress types that you can select, in the previous step, refer to the Theoretical Overview pages of the Fatigue Wizard help.
Start The Analysis:
To begin the fatigue calculations and initiate the fatigue analysis, click the green traffic light icon. You can monitor progress through the stages of the fatigue analysis. Details of the current analysis phase and estimated analysis time are reported.
To stop the calculations that are in progress, click the stop light icon.
When the calculations are complete, you see a summary of the worst fatigue results for any of the mean stress correction methods chosen, or for the two fatigue safety factor methods. The visualizer icon in the browser (tree view window) changes to indicate that fatigue results are generated and ready for viewing.