In this step, we examine the von Mises Stress values on the spring clip.
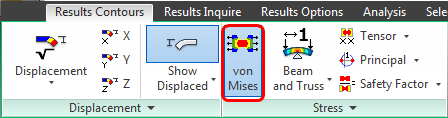
- Click von Mises from the Stress panel to display stress on the assembly.
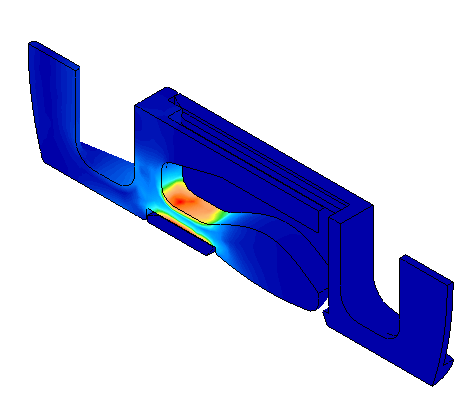
You should see this...
- To locate the location of the maximum stress, click Results Inquire
 Inquire (expand the drop-menu) Maximum Results Summary.
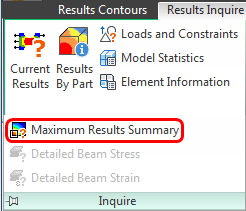
- Note the node number where the maximum stress occurs. Also, note the Load Case number (time step).
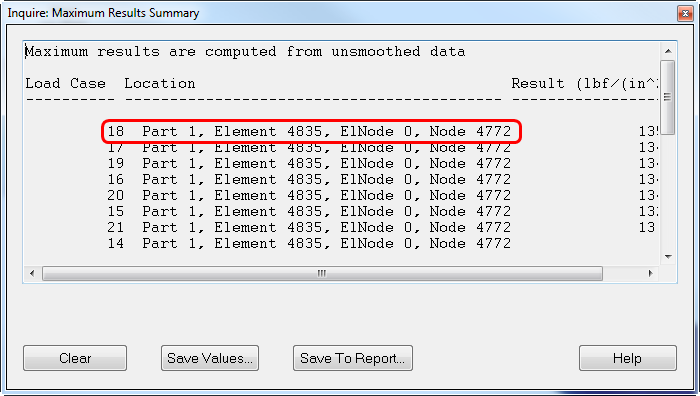 Note: Your results may indicate a different node number and value. Be sure to record the node and load case numbers that you see in your results.Important: The values in this summary are based on unsmoothed results. That is, there are multiple stresses at each node – one for each element that shares the node. The maximum of all of the stresses at a given node is reported by the Maximum Results Summary. By default, the legend and stress contour plot are based on the average of the stresses at each node (this is the default smoothing method). Therefore, the stresses in the summary will not agree with the values in the legend. Also, the maximum stress for unsmoothed results may occur at a different location than the maximum smoothed stress. We are using these values only as a way of identifying maximum stress locations. We'll see the smoothed values when we plot the time history of the stress.Tip: There are alternative ways of locating the maximum stress, such as activating the Maximum probe (Results Inquire Probes Maximum). Probes indicate the locations and magnitudes of stresses based on smoothed results, but only for the current time step.
 - Close the Inquire: Maximum Results Summary dialog box by clicking the "X" in the upper right corner.
Plot the stress at this location:
- Select a node near the red high-stress area. It doesn't matter if you don't select the most highly stressed node. We will specify the desired node number while creating the graph. (This is step 'a' in the figure that follows.)
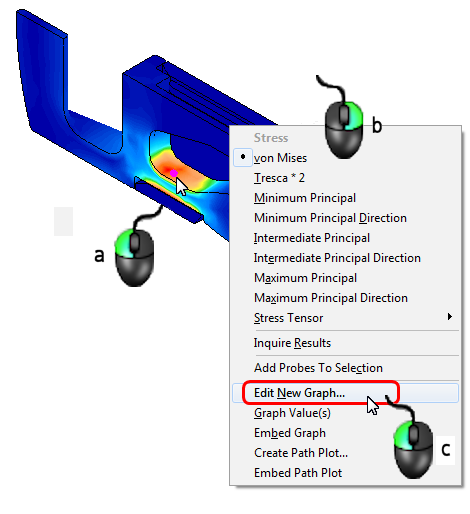
- (b) Right-click anywhere in the display area.
- (c) Select the Edit New Graph command.
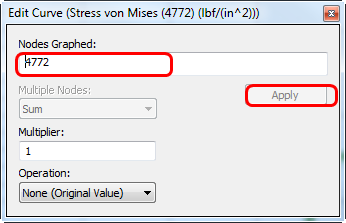
- Enter the recorded node number in the Nodes Graphed field and click Apply.
You should see this...
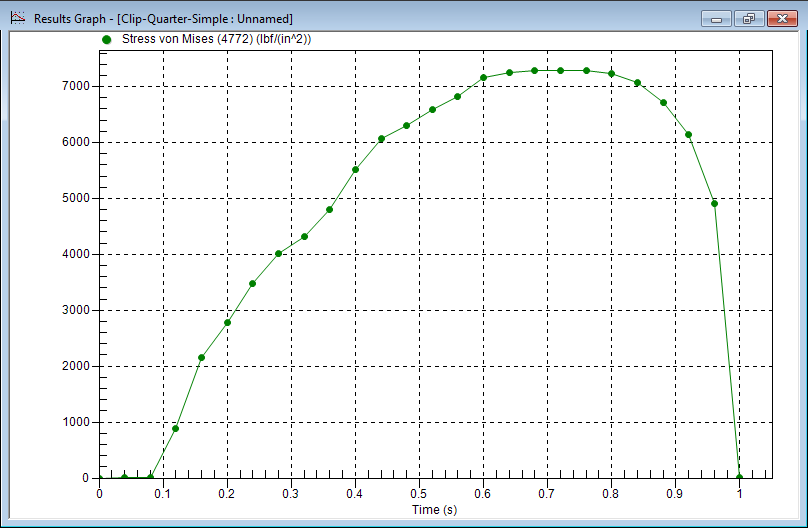
Note the time step at which the maximum stress occurs. In this case, it is time step 18 (0.72 second).
- To close the plot, click the "X" in the upper right corner of the graph window.