Access the Fatigue Wizard visualizer from any step of the analysis in the browser (tree view) of a form. The visualizer shows either the basic FEA model, or the FEA model with contoured fatigue results, depending on whether results are available. If a fatigue calculation is performed, the visualizer defaults to a contoured display of results.
Visualizer Functions:
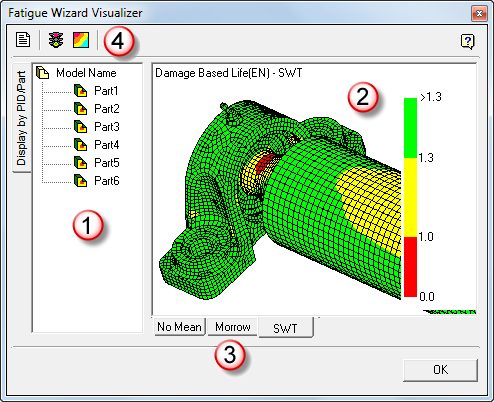
The Fatigue Wizard visualizer form is divided into several regions:
1. Browser (Tree View)
The browser frame displays a list of the constituent parts of a model, and shows the status of the display properties. You can set individual parts to display contoured results (if available), make invisible, or display just the underlying FE mesh of the part.
To set the display properties of a part
- Click on a part heading in the browser to change the part display settings. The part highlights in the graphics region, and the browser icon changes to a solid cyan to indicate that it is selected for change.
- Right-click anywhere inside the browser window. On the menu, select any of the following actions:
- Show (toggle part on if currently not displayed)
- Hide (toggle part off if currently displayed)
- Change color (select the part color to display when fatigue results are not shown)
- Toggle results (toggle between contoured fatigue results and the underlying part color)
2. Graphics Region
The graphics region contains the main display of the FE mesh and contoured results. The current display type and results set are displayed at the top left of the window.
Dynamic Viewing
You can pan, zoom, and rotate the FE mesh and contoured results using the following combinations of mouse and keyboard controls.
Fatigue Wizard contains full-time 3D dynamic viewing with your 3-button mouse. You can position the model to see it from any angle.
Consider the following image that shows the graphics region. Think of an imaginary XYZ axis at the centre of the screen, and an imaginary circle as shown.
The X axis points along the horizontal, the Y axis is vertical and the Z axis points out of the screen.
Rotation about X and Y (screen axes)
- Move cursor inside imaginary blue circle.
- Press and hold down the Left mouse button.
- Move up and down to rotate about X.
- Move left to right to rotate about Y.
Rotate freely
- Move in any direction to freely rotate the model about all three axes.
Rotation about Z (screen axis)
- Move cursor outside imaginary blue circle and near the left edge of the graphics area.
- Press and hold down the Left mouse button.
- Move up and down to rotate about Z.
Pan/Move in X and Y (screen axes)
- Move cursor inside imaginary blue circle.
- Press and hold down the Middle mouse button.
- Move up and down to move in Y.
- Move left to right to move in X.
Zoom
- Move cursor outside imaginary blue circle and near the left edge of the graphics area.
- Press and hold down the Middle mouse button.
- Move up and down to zoom in and out.
Using a combination of the above, you can position your model viewpoint anywhere you want.
Context Menu
Right-click in the main graphics region to view a menu containing some view options. There are several standard views, based on the global planes, and an Isometric view option.
In addition, you can Show or Hide the model rotation axes. When shown, click on one of the circles representing a particular plane of rotation and drag to rotate the view about the associated global axis. This tool constrains rotation to be only about the global X, Y, or Z axis.
Results
In a contoured results set display, a contour band is displayed on the right-hand side of the window. The contour bands vary from the minimum to maximum data values of the results set. You can customize as shown here.
You can also view the data as the number of cycles or Log10 number of cycles.
3. Result-Set Tabs
For each analysis type (SN, EN, or FSF) Fatigue Wizard, by default, calculates two or three different result sets. If you are calculating life, these results sets contain the three types of mean stress corrections available. If performing a fatigue safety factor calculation, they contain the two FSF calculation methods (constantR or constantM).
To display the individual result sets, choose any one of the results sets tabs at the bottom of the main graphics window.
4. Main Toolbar
The main toolbar is visible only if results are available, and is shown at the top of the visualizer screen. Use this toolbar for Report tools and Plot Types.
Plot Type
Fatigue Wizard displays two types of contoured results; the traffic light plot (3-colors), and a standard ten-band contour plot. To switch between the plot types, click the appropriate icon in the main toolbar.
The traffic light plot provides an overview of the regions of the model that shows acceptable fatigue results (green), marginal fatigue results (yellow), and unacceptable fatigue results (red). Fatigue Wizard refers to the desired result you entered on Step 5 to determine into which band the results fall.
This display is only a guide to those areas which require your further attention. You determine whether results calculated by the Fatigue Wizard are acceptable. When Fatigue Wizard creates the traffic light plot, any result below the desired value you entered is unacceptable, and it displays as red. Any result which is 1.3 times greater than the desired result you entered is acceptable, and displays as green. Results calculated by the Fatigue Wizard which fall between the other two classifications are deemed marginal, and display as yellow.
Report
Use Fatigue Wizard to generate an automatic report, summarizing the calculation parameters and results. Access the report using the report button. Edit and save using the buttons displayed in the main toolbar.
For further details on the report, see the Report Writer page.