All the loads in a Frequency Response analysis are specified in the Analysis Parameters dialog box. Right-click the Analysis Type heading in the tree view and choose Edit Analysis Parameters, or use the Setup Model Setup Parameters command to access the dialog box.
The Percent memory allocation on the Analysis Parameters dialog box controls how much of the available RAM is used to read the element data and to assemble the matrices. (When the value is less than or equal to 100%, the available physical memory is used. When the value of this input is greater than 100%, the memory allocation uses available physical and virtual memory.)
Click the Analysis Setup button to display the Frequency Response Analysis Input dialog box.
Since the Frequency Response analysis uses the results from a modal analysis, specify which design scenario in the current model has the modal results with the Use modal results from Design Scenario field at the top of the Frequency Response Analysis Input.
Define Exciting Frequencies
The exciting frequencies are defined in the Exciting Frequencies tab of the Frequency Response Analysis Input dialog box. You can create separate sets of exciting frequencies that can be applied to different areas of the model using frequency indices. By default, the frequencies is placed in the frequency index 1-Freq Index 1. You can create a new frequency index by pressing the New button. Specify each of the frequencies in the current frequency index by entering the values in the Frequency (Hz) column. If in addition to these frequencies, you want the natural frequencies to be included, activate the Include Natural Frequencies check box.
- Specifying multiple frequencies for a given index results in separate load cases. The structure is analyzed as if each frequency occurs independently, and then the square root sum of the squares (SRSS) is calculated.
- In the Results environment, you can view the in-phase, out-of-phase and SRSS excitations for each frequency. This is controlled by the options in the Results Options Analysis Specific Response Type pull-down menu.
- The frequency indices must start with index 1 and be sequential. For example, the indices must be 1, 2 and 3, not 1, 5 and 7.
- All frequency indices must have the same number of forcing frequencies.
Define Excited Nodes
The nodes to which the exciting frequencies are applied are defined in the Excited Nodes tab of the Frequency Response Analysis Input dialog box. If you want the same forcing frequency to be used for all load components, activate the Loads of the Same Frequency check box. If it is activated, a square root sum of the squares (SRSS) is not performed. If it is not activated, an SRSS is performed.
The value entered in the Cluster Factor for Natural Frequencies field is the minimum increase in frequency from one mode to the next, assuming you want these frequencies to be recognized as separate frequencies. A value of 0.1 indicates that the successive frequencies need to be 1.1 times higher to consider them as separate modes. This is useful when successive modal frequencies are very close. Use the cluster factor to ignore the duplicate mode.
You can use node sets to apply different frequency indices to different nodes. By default, the nodes is placed in 1-Node Set 1. To create a new node set, press the New button.
For each node set, you can either apply the frequency to a specific node or to any node that contains a boundary condition. To apply the frequency to a specific node, select the Node Number of Applied Excitation radio button in the Node Number section and specify the node number in the adjacent field. To apply the frequency to any node that contains a boundary condition, select the Base Acceleration Motion radio button in the Node Number section.
If the load being applied to the nodes is an acceleration, select the Acceleration Input radio button in the Type of Excitation section. If the load being applied to the nodes is a force, select the Force Input radio button in the Type of Excitation section. Next, select the appropriate radio button to define the direction of the load in the Direction of Excitation section. For nodal excitation, the directions correspond to the local coordinate system to which the node is assigned. For example, X Direction follows the radial direction in a cylindrical coordinate system. (See the page Setting Up and Performing the Analysis: Using Local Coordinate Systems for additional details.) For base acceleration, the directions correspond to the global directions.
Specify the frequency index that is applied to the current node set in the Index of Exciting Frequency Definition drop-down menu. If the Loads of the Same Frequency check box is activated, you can specify a phase shift angle in the Phase Shift (in degrees) of Applied Excitation field. Finally, you must specify a scale factor in the Scaling Factor for Amplitudes field. It multiplies the amplitude of the load applied to this node set.
Define Damping Ratios
The damping ratios (fraction of critical damping) are defined in the Damping Ratios tab of the Frequency Response Analysis Input dialog box. You create a damping ratio vs. frequency curve by defining data points in the Frequency (Hz) and Damping Ratio columns.
The damping ratio values at the exciting frequencies specified on the Exciting Frequencies tab is calculated by linearly interpolated between the frequency values in the Damping Ratios tab. Thus, the frequencies in the Damping Ratios tab do not need to match the exciting frequencies. (If only one row is entered, the damping value is used for all exciting frequencies.)
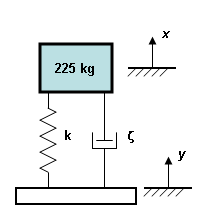
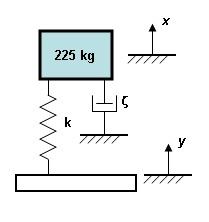
The damping is not specific to a given element; the damping is distributed over the entire model, or equivalent viscous damping. Thus, the forces due to damping do not appear in the results. For example, the engineering representation of a structure subject to base acceleration is typically shown as in Figure 1a. The force to move the base (y) includes the damping force z. Since the damping in FEA is viscous damping, a better representation of the analysis is shown in Figure 1b. In this scenario, the damping force does not appear as a result in the analysis. The force reported in the spring k does not include damping.
 |
|
| Figure 1a: Engineering Schematic | Figure 1b: FEA Representation |
Define Amplitudes
The amplitudes are defined in the Amplitudes tab of the Frequency Response Analysis Input dialog box. You create an amplitude versus frequency curve by defining data points in the Frequency (Hz) and either the Acceleration or Force columns. The acceleration input is in units of G's; any value determined from this table is converted to acceleration using the gravitational constant. The force input is in units of force based on the unit system.
The acceleration and force values at the exciting frequencies provided on the Exciting Frequencies tab is calculated by linearly interpolated between frequency values in the Amplitudes tab. Thus, the frequencies in the Amplitude tab do not need to match the exciting frequencies. (If only one row is entered, the amplitude value is used for all exciting frequencies.)
If any exciting frequency to the structure is located beyond the smallest or largest frequency entered in the Amplitudes tab, the amplitude of the closest input frequency is used. Thus, to apply the same load to all exciting frequencies, only one row of input is needed on the Amplitudes tab.
Control Data in Output Files
Before the analysis is performed, you can indicate to output additional results. Use the Output Controls section of the Analysis Parameters dialog box to indicate what results to write out.
- Activate the Displacement data check box or the Stress data check box to get the relevant results in the summary file or stress text file, respectively. Since this output can be quite voluminous, and the results available in the Results environment are not affected by these settings, it may be better to use the Results environment if only selected results are needed.
- Activate the Stress/strain at midside nodes (binary) check box to get the stress and strain at midside nodes output to the binary result files. These results can then be displayed in the Results environment. (Midside nodes are an option that can be activated for certain element types using the Element Definition dialog box.)