We will now look at the stress distribution at 0.25 seconds, when the peak stress occurs. We will also graph the stress versus time at the most highly stressed node.
- Click
 Results Contours
  Load Case Options Load Case Set.
 - Type 9 in the Enter load case field.
- Click OK. The results at 0.25 seconds (Time Step 9 of 36) will be displayed. The maximum von Mises stress is approximately 410 psi.
- Activate
 Results Inquire Probes Maximum. A probe will appear on the model.
 - Use
 View Navigate Zoom Window to zoom in on the end of the crank where the maximum stress occurs.
 - Right-click on the Part 6 heading in the browser and clear the Visibility option. We want to graph only the crank stress, not the crank and joint stresses.
- With the
 Selection Shape Point or Rectangle and
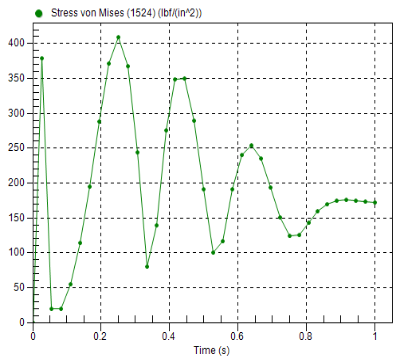
  Selection Select Nodes commands active, select the most highly stressed node, as indicated by the probe.
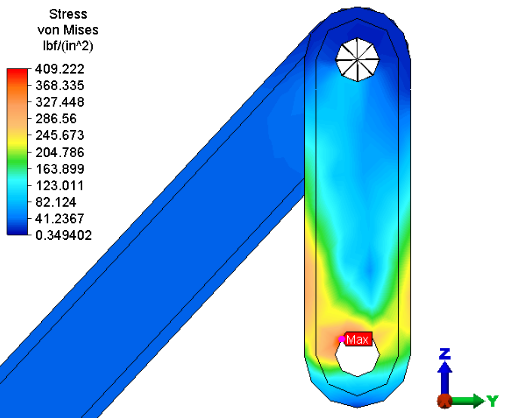
- Right-click in the display area and choose Graph Value(s). The stress versus time for the selected node will be displayed, as shown below.
- Click the 2 <Stress> heading under Presentations in the browser to return to the previous results plot.
- Deactivate the Results Inquire Probes Maximum.
- Click
 View Navigate Enclose (Fit All) to fit the model in the display area.