One of the leading causes of equipment failure in harsh flow environments is surface erosion due to high-velocity liquid flow impingement. Understanding where erosion may occur is essential for designing for greater durability and longer service life.
Contaminants such as sand, quartz, and fly ash cause material erosion as they recirculate and impinge against valves and other machinery. In the oil and gas industry, engineers evaluate this Ductile erosion based on the "mesh size" of the particle. The mesh size is the largest particle size that is likely to be found in a system. This phenomenon is also referred to as "washout."
Autodesk Simulation CFD uses Lagrangian particle tracking with the Edwards Model to compute erosion. A low particle concentration assumption (not a slurry erosion model) is employed, and results are presented as a scalar result quantity. This facilitates design comparison, and removes the guesswork from interpreting erosion predictions.
The erosion model uses angle of attack bounce data and the Brinell material hardness to compute the material volume removal rate. This approach qualitatively identifies areas subject to erosion. It illustrates the relationship between the flow and erosion trends, which can lead to erosion reduction through design improvements.
For more about the theoretical background of erosion, click here.
View Erosion with Massed Particle Traces
Setup and run the simulation using standard modeling practices. (There are no steps to perform prior to launching the calculation.)
- Create a results plane, and move it to an inlet. Open the Trace dialog.
- Select Rectangular grid as the trace seeding method, and check Use grid spacing. (Note that the other seeding methods are also suitable.)
To adjust the Grid spacing density...
- Enable vectors on the results plane.
- On the Vector settings tab of the Plane Control dialog, drag the Grid spacing slider.
- Click Add trace set.
- Click Trace list...
- Click Mass... near the bottom of the Traces dialog.
Properties of Sand
These are the properties of sand, the cause of erosion in many systems:
- Particle density = 2705 kg/m3
- Radius = 0.014 in
- Coefficient of restitution = use default value (computed as part of erosion calculation)
- Time step size = The time step size is automatically computed to ensure that the particle passes through an element in one time step.
- On the Mass dialog, click Enable/Update Erosion.
It is a good idea to hide the traces after erosion results are generated. This improves graphical performance significantly, and makes it easier to view erosion on surfaces of the model.
To update the erosion results after modifying any of the parameters on the Mass dialog, click Enable/Update Erosion.
The Erosion Rate result is not available while the simulation is running, and is removed when a simulation is continued. Follow the procedure described above to display erosion after the simulation is stopped.
Erosion Example
The Erosion Rate result appears on particle traces and on wall surfaces. Traces show the interaction between the flow and solid obstructions. The erosion scalar distribution shows the relative severity of the erosion.
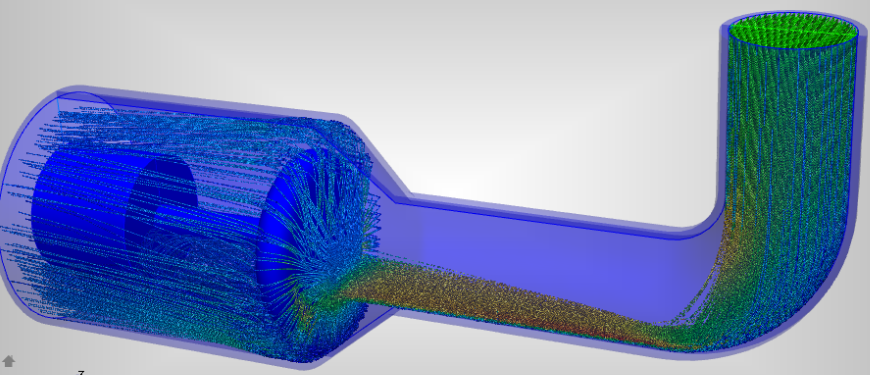
In the following example, flow enters a valve, turns, and impinges on the pressure face of the poppet. These traces do not include mass, and simply illustrate the flow distribution:
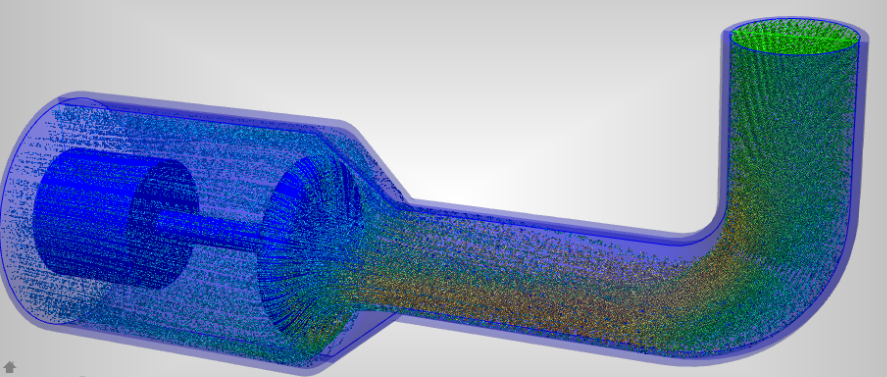
When mass is enabled on the traces, we see how particles in the flow impinge on the outside area of the bend and on a relatively small area of the poppet face:
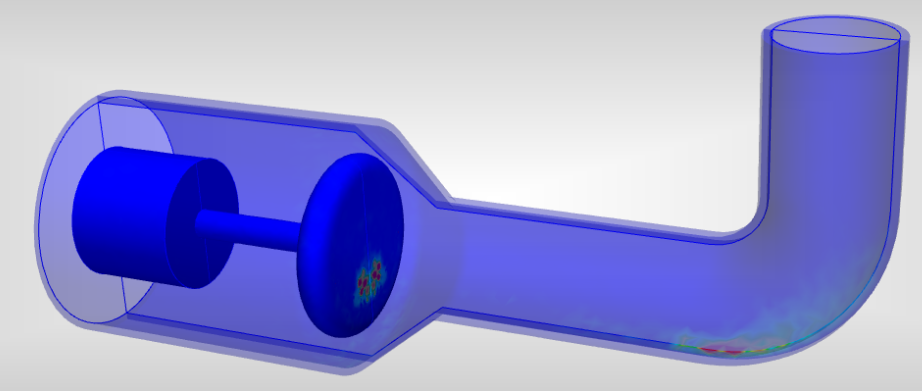
The areas of highest erosion occur on the outside radius of the elbow and on the lower portion of the poppet face:
Material Hardness
The Brinell value is used to characterize the hardness of the material. This is an important parameter for predicting the erosion rate because a softer material typically erodes faster than a harder material.
The Hardness value is available from the Results > Materials branch of the Design Study bar. Because hardness is an attribute that only applies to solid materials, hardness values specified on fluid parts are automatically assigned to the wetted wall surfaces of that fluid part. Surfaces that are shared between a fluid part and a solid part are assigned the hardness value assigned to the solid part.
There are three ways to select entities to assign hardness:
- If all solid parts or wall surfaces have the same hardness value, specify a hardness value on all parts. Right click on Results > Materials of the Design Study bar.
- If the model contains multiple materials, and there are several parts assigned to each material, specify a hardness value at the material level. Right click on a material name in Results > Materials of the Design Study bar.
- The most granular method is to specify hardness at the part level. This is most useful when the same fluid material is assigned to the several parts that have different wall hardness values at their surfaces. Right click on a part name in Results > Materials > material of the Design Study bar.
To assign the hardness value:
- Click Set material hardness....
- Enter the hardness value in the Set Hardness Value dialog.
- On the Mass dialog, click Enable/Update Erosion.
Comparing Erosion across Multiple Scenarios
To view summary images showing erosion in the Design Review Center, perform the following procedure:
- After creating an erosion view, save a Summary Image.
- Save a view settings file containing the massed particle traces used to compute erosion. This ensures that the same number of traces is used in each scenario. (This is essential to ensure consistent results.)
- Open each scenario, and apply the view settings file. Open the Massed Traces dialog, and click Enable/Update Erosion.
- In the Decision Center, update the Summary Image. Use the Design Review Center to compare the results from each enabled scenario.