Il Centro decisioni è un ambiente semplice ma efficiente per il confronto di diverse alternative di progettazione. È possibile utilizzarlo per identificare la progettazione che soddisfa i propri obiettivi di progettazione.
Si tratta di un potente strumento per:
- Estrarre i valori di risultati specifici
- Confrontare i risultati di diversi scenari
Gli oggetti di visualizzazione come le parti, i piani e i punti dei risultati, oltre ai grafici XY, costituiscono la base del Centro decisioni. Creare un oggetto in uno scenario e contrassegnarlo come oggetto di "Riepilogo" per fare in modo che il Centro decisioni calcoli i risultati in ogni scenario dello studio.
Per aprire Centro decisioni, fare clic sulla scheda Risultati > gruppo Confronta > Centro decisioni. Centro decisioni viene visualizzato nella metà inferiore della barra Studio di progettazione.
Utilizzare il Centro decisioni per gestire tutti gli elementi di riepilogo:
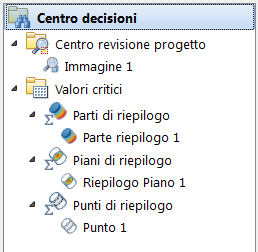
Sono disponibili tre componenti principali del Centro decisioni:
Design Review Center: Visual
Use the Design Review Center to compare results from multiple scenarios visually. It is a powerful tool for comparing flow and thermal performance of two or more scenarios in a design study.
Compare results either by incrementing through a set of scenarios in a single view or by positioning multiple images side-by-side.
Use the Design Review Center to answer questions like "Which design produces the most uniform flow distribution?" and "Which design keeps the critical components coolest?"
For an example of the use of the Design Review Center
For more about the Design Review Center
Critical Values: Tabular
Use Critical Values for comparing results from individual and multiple scenarios.
There are three types of Critical Values Entities. Each is based on a different Summary Entity type. Each answers questions such as "What is the maximum temperature?", "Which design produces the lowest pressure drop?", "Does the velocity at a point near a critical component exceed a design limit?"
Summary Parts
Summary Parts are used to assess results on Fluids, Solids, Internal Fans, and Compact Thermal models. Use them to extract the following quantities:
|
Material or Device type |
Critical Values Quantities |
|
Fluids and Solids |
|
|
Compact Thermal Model |
|
|
Internal Fans |
|
Use Summary Parts to answer questions like: "What is the maximum temperature on these chips?" and "What is the operating condition of this fan?"
Summary Planes
Summary Planes are planar cutting surfaces at critical locations in the model. Average values from each summary plane are presented in the Critical Values table. Summary Planes are ideal for:
- Determining the pressure, flow rate, and average flow velocity through a channel or at an opening
- Comparing results at openings from several design alternatives.
Use Summary Planes to answer questions like: "Which design produced the lowest pressure drop?" and "Which leg of the manifold has the highest flow rate?"
Summary Points
Summary Points are locations within a model on which specific result quantities are monitored. Summary Points are ideal for:
- Determining the temperature, pressure, or local velocity at critical locations within a model
- Comparing results at finite points from several design alternatives
Use Summary Points to answer questions like: "Which design produces the most uniform velocity or temperature distribution across a set of points?" and "Does the pressure at a point near a critical component exceed a design limit?"
Results are presented in a spreadsheet-like table in the Critical Values tab of the Output Bar. The Critical Values table provides a simple way to quickly extract, present, and compare results from individual and multiple scenarios.
For an example of the use of the Critical Values Table
For more about Critical Values
XY Plot Data: Graphical
Compare results by overlaying XY Plot data from multiple scenarios on a single plot.
Use Summary Plots to answer questions like: "How does the pressure vary across the flow channel as the design is changed?" and "How does the temperature gradient respond as the design is modified?"