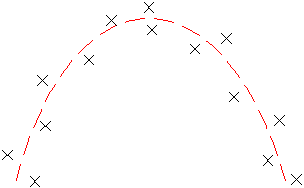
The best-fitting parabola through the points is calculated. You can then use a dialog box to exclude any of the specified points or to select one or two pass-through points.

Note: When using the best fit commands for profile design, use the Create Parabola command for vertical curves. See Vertical Curve Design for more information.
To create an AutoCAD parabola by best fit from existing elements
- If you are creating a best fit parabola for a profile, set the profile view style vertical exaggeration to 1. See Creating and Editing Profile View Styles for more information.
- Click tab
 panel
panel 

 .
. - In the Parabola By Best Fit Dialog Box, select From Elements. Specify the tessellation and mid-ordinate tolerance settings.
- Select one or more of the elements listed at the command line. Note: You may select several types of elements listed at the command line.
As you select elements in the drawing window, a white X marks each regression point and a temporary, dashed parabola is displayed in real time.
Note: You must select at least three non-collinear regression points. - If you selected a profile object, specify the starting and ending chainage on the Specify Chainage Range Dialog Box.
- Press Enter to complete the command.
- In the Panorama window, use the Regression Data vista to make changes to the regression points.
As you highlight a row in the Regression Data vista, the corresponding regression point in the drawing window will be highlighted in red.
Note: When the AutoCAD parabola is created, it will not retain any link to the regression points. - Create the AutoCAD parabola:
- Clik
 to create the parabola and keep the regression data. You may then use the data as a basis to create more parabolas.
 - Click
 to create the parabola, clear the regression data, and close the Regression Data vista.
- Clik
- If desired, convert the AutoCAD parabola to an alignment or profile element.
To create an AutoCAD parabola by best fit by clicking on screen
- If you are creating a best fit parabola for a profile, set the profile view style vertical exaggeration to 1. See Creating and Editing Profile View Styles for more information.
- Click tab
 panel
panel 

 .
. - In the Parabola By Best Fit Dialog Box, select By Clicking On The Screen.
- Select a starting point and at least two other points. Note: You may use OSNAP or transparent commands to select points.
As you select points in the drawing window, a white X marks each regression point and a temporary, dashed parabola is displayed in real time.
Note: You must select at least three non-collinear regression points. - Press Enter to complete the command.
- In the Panorama window, use the Regression Data vista to make changes to the regression points.
As you highlight a row in the Regression Data vista, the corresponding regression point in the drawing window will be highlighted in red.
Note: When the AutoCAD parabola is created, it will not retain any link to the regression points. - Create the AutoCAD parabola:
- Clik
 to create the parabola and keep the regression data. You may then use the data as a basis to create more parabolas.
 - Click
 to create the parabola, clear the regression data, and close the Regression Data vista.
- Clik
- If desired, convert the AutoCAD parabola to an alignment or profile element.