Viewing contour plots of specific state variables is the best way to evaluate the structural performance of the coupon. In particular, we will examine SDV1 (rupture state) and SDV9 (matrix tangent elastic modulus).
- After the job has completed, click from the main toolbar in Abaqus and open coupon_output.odb. This will open the output database file and switch to the Visualization module. The undeformed coupon appears in the viewport.
- Click to display the contour plot.
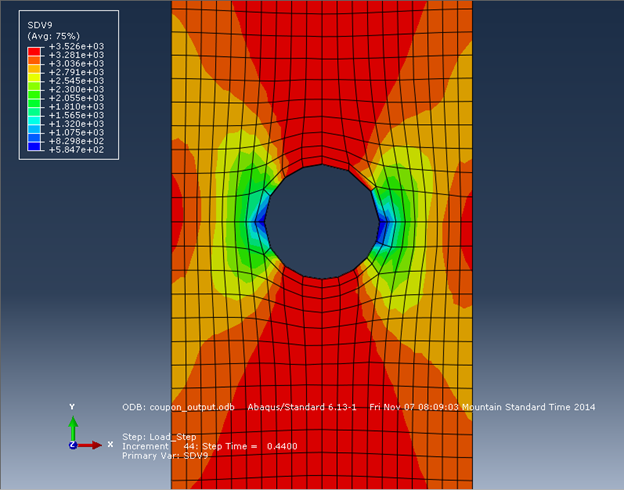
- Now select SDV9 from the list of output variables (Result > Field Output). SDV9 represents the tangent elastic modulus of the matrix material.
- Step through the analysis and monitor SDV9 as the tensile displacement load is applied to the coupon. Notice how the values of SDV9 near the hole are much lower than the remainder of the coupon. This indicates a large amount of plasticity, or material softening.
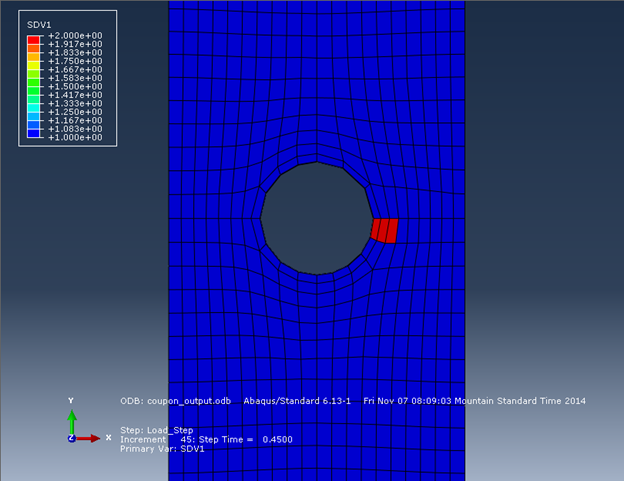
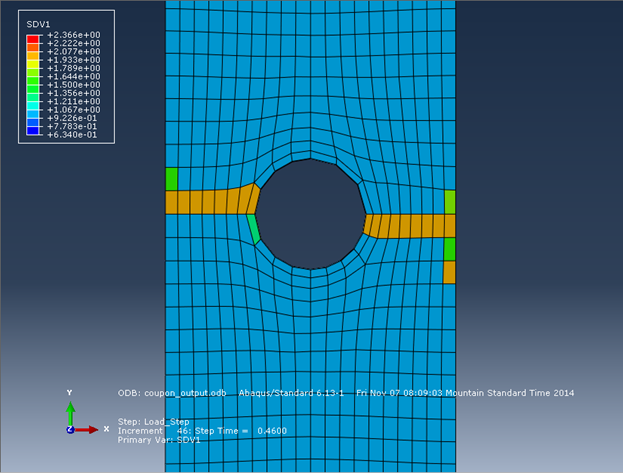
- Now switch to SDV1 to examine the rupture state of the composite part. A value of 1.0 indicates the composite has not failed. A value of 2.0 indicates the composite has failed. It is best to view SDV1 with a quilt plot (Options > Contour).
- By monitoring SDV1 throughout the load history, we can see that failure progresses very quickly between Step Time = 0.45 and 0.46. It is possible, that if we reduce the load, or increase the number of intervals in the step, we could capture a better progression of failure.