Load-displacement plots are commonly used as a tool to determine the global stiffness response of a structure.
They are particularly useful for progressive failure analyses since they are a simple means of determining how the structure behaves as failure initiates and progresses. To generate a load-displacement plot, data must be extracted from the output file.
- Select . In the dialog box that appears, select the ODB field output option and click Continue.
- In the dialog box that appears, select Unique Nodal for the Position and check the RF2 and U2 check boxes. On the Elements/Nodes tab, click Node sets and select TOP_LOAD_NODE.
- Click Save.
- Select . In the dialog box that appears, there will be two sets of data. To write this data to a file, it must be renamed using the Rename button.
- After the data is renamed, it can be output to a text file by selecting .
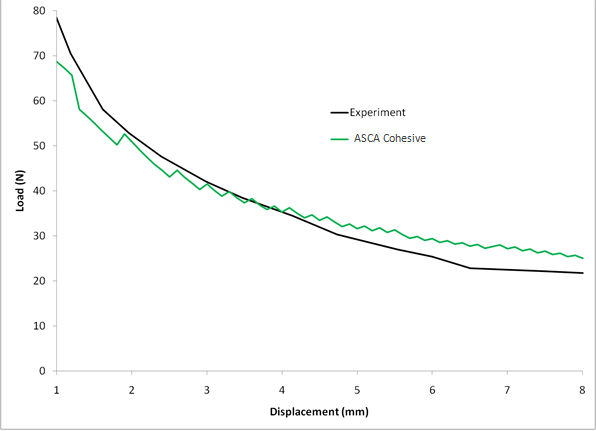
The plot of reaction force (RF2) vs. displacement (U2) is given below. The Simulation Composite Analysis solution is in good agreement with the experimental [1] plot.