View the state variable outputs from Simulation Composite Analysis that are stored in the output database file.
Refer to Appendix D of the Simulation Composite Analysis User's Guide for definitions of all 9 cohesive material state variables.
- After the job has completed, click from the main toolbar and open ASCA_Tutorial_4.odb. This will open the output database file and switch to the Visualization module. The undeformed beam appears in the viewport.
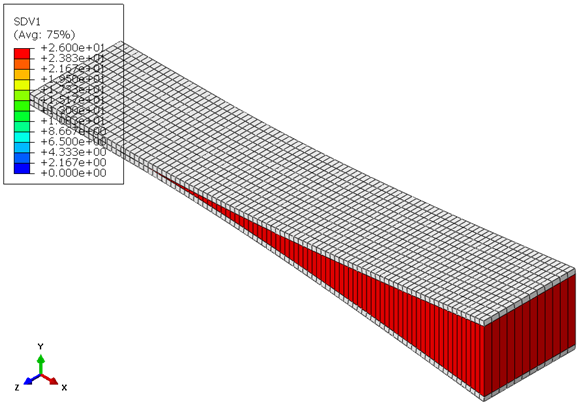
- To view SDV1, click from the main toolbar and select SDV1 from the list of output variables. A contour plot of the beam at time = 1.0 is given below.
- Tip: When viewing results for cohesive elements, it is useful to display only the cohesive elements. This can be done using the Display Group tool () or using the Display Group Boolean icons
 .
.
- Tip: When viewing results for cohesive elements, it is useful to display only the cohesive elements. This can be done using the Display Group tool () or using the Display Group Boolean icons
- Progress through the load history and note the progression of SDV1.
- Notice that each failed integration point goes from unfailed (SDV1=0) to fully failed (SDV1=26) in the span of one increment. This is simply a result of the extreme delamination being forced onto the beam. More complex loadings will typically result in a progression of SDV1 values.
- Notice that each failed integration point goes from unfailed (SDV1=0) to fully failed (SDV1=26) in the span of one increment. This is simply a result of the extreme delamination being forced onto the beam. More complex loadings will typically result in a progression of SDV1 values.
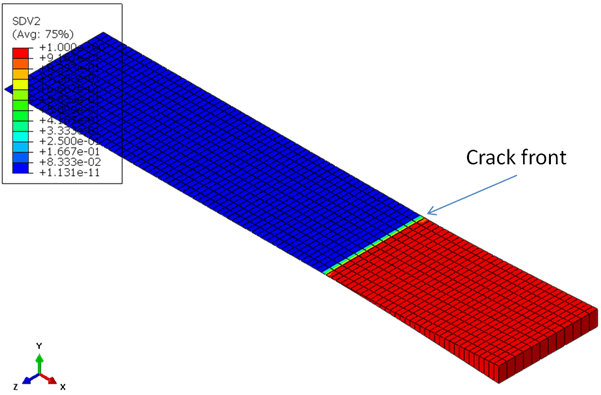
- Plot SDV2 and display just the cohesive elements as shown below.
- Progress through the load history and probe the values of SVD2 at the advancing crack front.
- For the failed integration points, SDV2 = 1. At the failure front (the region between unfailed and failed elements), the values are 0 < SDV2 < 1.
State variable SDV1 represents the damage state at each integration point in cohesive elements that use Simulation Composite Analysis cohesive materials. This value is an integer between 0 and 26. A value of 0 means damage has not initiated and a value of 26 means damage has fully evolved at the integration point and its stiffness has been reduced to zero. Intermediate values, say a value of 10, mean that damage has initiated and the stiffness of the element has been partially reduced.
State variable SDV2 represents the failure index at each integration point. It is a continuous variable that can have a value between 0 and 1. A value of 0 indicates there are no stresses (or only normal compressive stresses) at the integration point. A value of 1 indicates that the failure initiation criterion has been satisfied and the process of damage evolution (stiffness reduction) has begun at the integration point. Intermediate values, for example 0.50, mean that 50% of the failure initiation criterion has been satisfied.
Another useful state variable is SDV6, which is referred to as the damage variable (D). SDV6 is a continuous variable between 0 and 1 that indicates how much damage has occurred at the integration point. A value of 0 corresponds to an undamaged integration point that has its original (full) stiffness. A value of 1 corresponds to a fully degraded (zero stiffness) integration point.
In summary, SDV2 can be thought of as a "pre-failure" measure of how close the integration point is to failure initiation and SDV6 can be thought of as a "post-failure" measure of how close the integration point is to complete stiffness reduction after failure initiation.