Load-displacement plots are commonly used as tools to determine the global stiffness response of a structure. They are particularly useful for progressive failure analyses as they are a simple means of determining how the structure behaves as failure initiates and progresses. To generate a load-displacement plot, data must be extracted from the output file.
- Select . In the dialog box that appears, select the ODB field output option and click Continue.
- In the dialog box that appears, select Unique Nodal for the Position and check the RF2 and U2 check boxes. On the Elements/Nodes tab, click Node sets and select LOAD_NODE. Note: Due to the equation constraint defined earlier, the total reaction force can easily be determined from just the load node.
- Click Save, click OK, and click Dismiss.
- Now we can copy the data to Microsoft Office Excel for plotting. Click . Highlight both sets of data and click OK to create a text file with the load-displacement data.
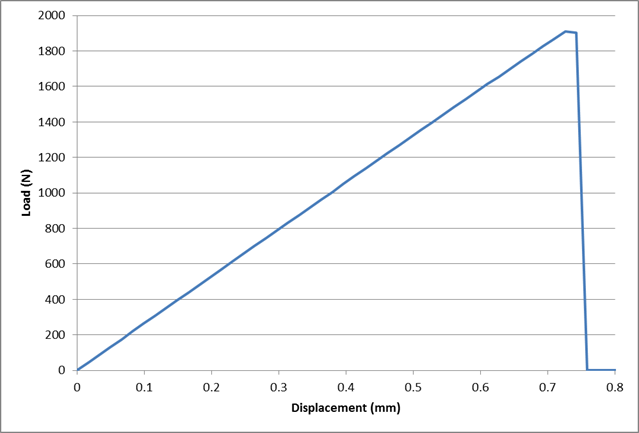
The plot of the load-displacement curve shows an ultimate load of 1911 N. The final catastrophic failure event occurs at a displacement of roughly 0.73 mm, between Step Time = 0.44 and 0.45. Using this information, we can relate the catastrophic failure to the contour plot of the damage. These two pieces of information are useful for determining how localized failures affect the global response of the structure.