Determine the global stiffness response of a structure using a load-displacement plot.
These plots are particularly useful for progressive failure analyses as they are a simple means of determining how the structure behaves as failure initiates and progresses.
- Click .
- In the GUI that appears, click the Add Data icon (the green plus sign).
- Select . Click OK.
- From the graphics window, select the node that had the specified displacement (refer to the image in the Define the Load section). Click OK.
- Repeat steps 2-4, but instead, select .
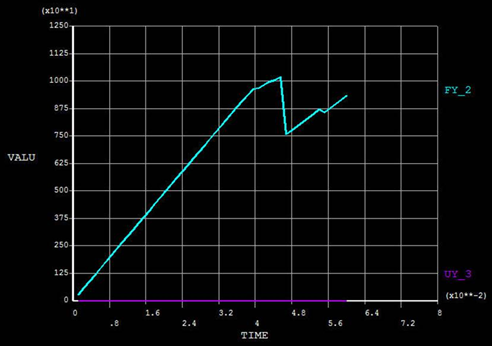
- To plot the reaction force vs. displacement, set the X-Axis to UY_3, select FY_2 and UY_3, and click the Graph Data icon. Refer to the image below.

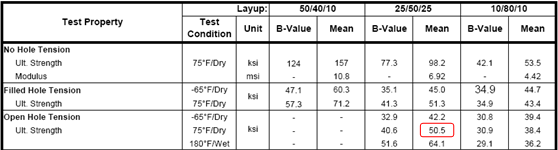
The load-displacement plot is shown below. The sharp drop in stiffness at a displacement of 0.0468 corresponds to ultimate failure of the plate. The simulated ultimate load is 10,180 lbs and the strength is 47.1 ksi. The experimental [1] strength of the plate is given in the table below as 50.5 ksi. The ultimate strength predicted by Simulation Composite Analysis and the experimental strength differ by 6.7%.