In this exercise, you will use styles to view the point cloud object in different ways, as well as to filter the display of imported point cloud data.
This exercise continues from Exercise 1: Importing Point Cloud Data.
Display point cloud points by elevation
- In the drawing, select the point cloud.
- Click tab
 panel
panel  drop-down
 .
. - In the Point Cloud Properties dialog box, on the Information tab, under Point Cloud Style, select Elevation Ranges.
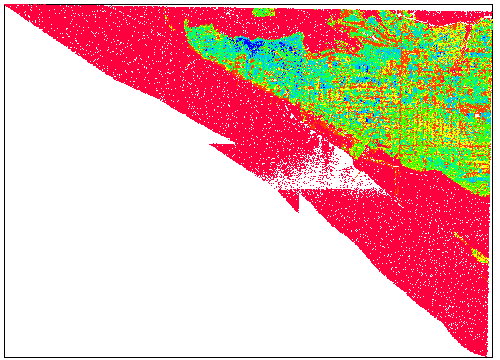
This point cloud style displays point cloud points as a specified color, based on their elevation value.
- On the Elevation Ranges tab, click Reset From Style.
This action specifies that the point cloud style parameters determine the display properties of the point cloud.
- Click OK.
The point cloud now shows the major differences in elevation between the point cloud points. In the following steps, you will view point cloud points by the classification code that was assigned to them as they were created.

Display point cloud points by classification
- In the drawing, select the point cloud.
- Click tab
 panel
panel  drop-down
 .
. - In the Point Cloud Properties dialog box, on the Information tab, under Point Cloud Style, select LIDAR Point Classification. Click OK.
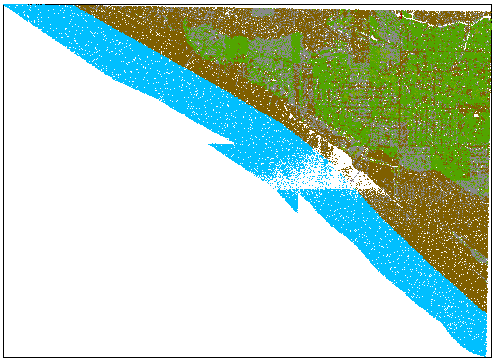
The point cloud now shows the color-coded point cloud points. This is a useful way to see different features that were captured during the scan. In the following steps, you will adjust the point cloud style to filter unwanted features from the point cloud.

Filter points by classification
- In the drawing, select the point cloud.
- Click tab
 panel
panel  drop-down
 .
. - In the Point Cloud Style dialog box, on the Classification tab, click
 .
. For this exercise, you will specify that the style display only the ground points.
Note:The classifications in this table are based on ASPRS standards.
- In the LIDAR Classification table, select the 2 Ground check box.
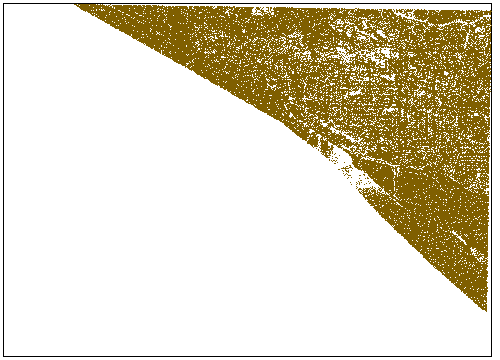
As shown in the Color column, the point cloud points that are assigned the 2 classification are displayed as brown.
- Click OK.
In the drawing, only brown, Ground points are displayed. In the next exercise, you will learn how to create a AutoCAD Civil 3D surface from this subset of point cloud points.
Note:If the display does not change, enter REGEN on the command line.

To continue this tutorial, go to Exercise 3: Adding Point Cloud Data to a Surface.