Analyzing Machine Utilization and Power Consumption in Factory Layouts
To analyze machine utilization and power consumption:
- Click Factory tab > Analysis panel > Machine
 .
. The Material Flow Browser displays the Routings tab with the list of Jobs.
- All jobs are immediately analyzed and the results presented.
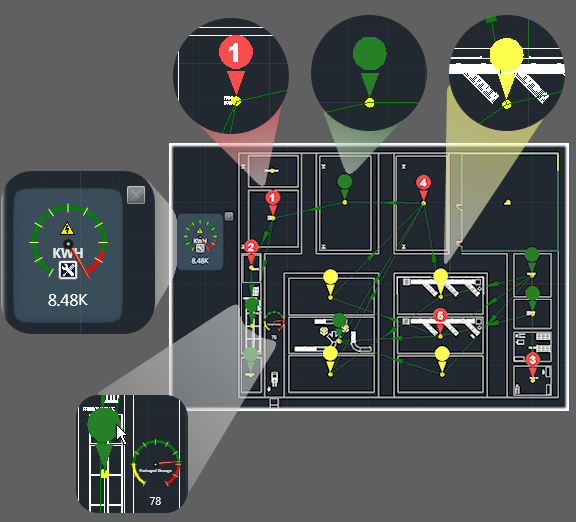
- The Power Consumption indicator displays the analysis results. Flags display the utilization status for each station.
The flag color is based upon the Utilization Settings. Yellow = under utilized, green = well utilized, and red = over utilized.
- To perform a discrete analysis of one or more jobs, right-click the analysis indicator and click Select Job. Then, in the Material Flow Browser select one or more jobs to analyze. After selecting the jobs to analyze, press Enter.
- To view the utilization for a specific station, pause the cursor over the station flag. A gauge displays the utilization value for that specific station.
- To add a station gauge to the display, right-click the station flag and in Optimization select Add meter to dashboard. You can add multiple gauges to the dashboard.
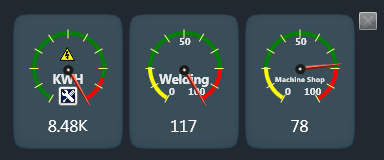
- To remove a gauge from the dashboard, right-click the gauge and in Close Indicator select the name of the gauge to be removed.