The Intent Rule evaluator is a stack-based virtual machine. It performs the specific operations used in rule-based modeling. It runs a compiled version of the Intent Language with high-level instructions. These instructions are similar in appearance to assembly-language, and not designed for reading by humans.
The Intent Debugger capability is invoked when you encounter a specific high-level instruction, called debug_break. Until you see this instruction, there is no difference between normal Intent evaluations, and there is no performance impact.
You can invoke the debugger with the special statement _debug. The presence of the _debug statement in a rule body causes that rule to compile a debug_break instruction in that location. If you encounter it during evaluation, the debugger dialog box then displays, with the evaluator halted at that point. The _debug statement has no other effect; it does not cause changes in any part of the system.
The Intent Debugger is not a “source” debugger. The instructions do not map to source lines such as instructions that allocate, initialize, and deallocate local variables, perform type-checking, and get and set Rule values. There are also instructions that are included because of the presence of certain flags, such as Parameter and Lookup. There is no intent to document fully the compiled version of the language.
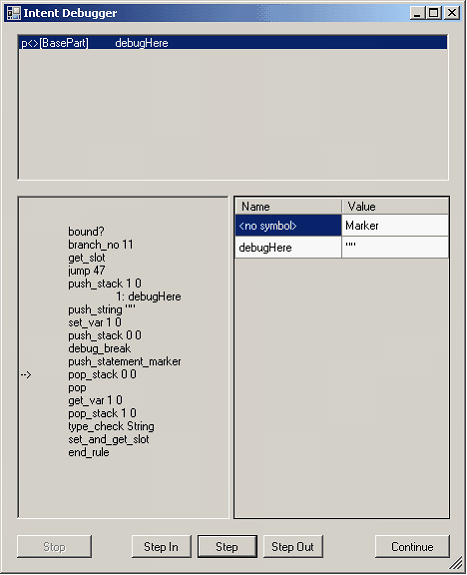
Rule that invokes Intent Debugger
Each rule consists of three parts: the leader, the body, and the trailer. The leader and trailer parts work together to handle flags and initializing, and returning the return value for the rule. In this case, the body of the rule sits between the push_stack 0 0 and pop_stack 0 0 instructions. It is just the debug_break instruction, and a push_statement_marker instruction (which is always present after a debug_break for housekeeping reasons).
The bound? Instruction determines if this rule is already evaluated and saved. Unless a rule is Uncached, this check is its first statement. If no, the evaluation proceeds, but if yes, it gets the value out of the saved “slot”, and jumps to the end_rule instruction. The value 47 is the actual number of bytes that must be jumped. Each instruction can consume from 1 to 9 bytes.
To start, the evaluation sets up the return variable with the same name as the rule, and in this case is a string. The instructions set up a local variable frame of one element (on the data stack). They give it the value of an empty string (default for a string type). This state is present when the debug_break is hit. The data stack shows the return variable name and value.
Now you can watch the evaluation. There is no way to get a debug_break instruction earlier in the evaluation. We show how to step through those statements later.
Click Step, and the evaluator takes one step, and pushes a statement marker onto the data stack.

There is <no symbol> in the data stack “Name” column. Not all data on the stack has a name. Only the items that are local variables have names.
If you step through the pop_stack 0 0 instruction, you see no change. In fact, both push_stack 0 0 and pop_stack 0 0 do nothing in this case. An optimize can remove them both. The pop removes the statement marker. The next few instructions close out the rule. First, get_var gets the debugHere value off the data stack. Then the stack is popped, leaving the value on top (without the name), checked for being a String, set as the slot value, and returned.
When you step over the end_rule instruction, the value returns, and you see the result in MinHost properties.
At any time, you can click an evaluation frame, and inspect the instructions for that rule, and the status of the execution for that rule.
Tips for using the Intent Debugger
- Do not insert _debug statements in many rules as a standard development technique. It can help you understand Intent internals, but it also consumes considerable time. Focus on one or two rules at a time, using the step in / step out functions to navigate around them.
- You cannot insert the _debug statement into a single-line rule. However, you can step into single-line rules.
- The Intent Error Handler does not operate in the same environment as the Intent Debugger. In the debugger, the evaluation is still in progress, and is halted. In the error case, the error has happened, been captured, and evaluation exited. The error handler dialog box shows what was captured, long after the error itself occurred. Putting a _debug statement in the rule getting the error allows you to step before the error occurs. After the error occurs, the error-handling logic takes over, and the debugger can no longer operate.
- The debugger is currently reset at every step. It does not maintain its scroll state between steps.