Dalton Standalone is a pipe network analysis solution which simulates the flow behavior in a distribution network.
User Interface Overview
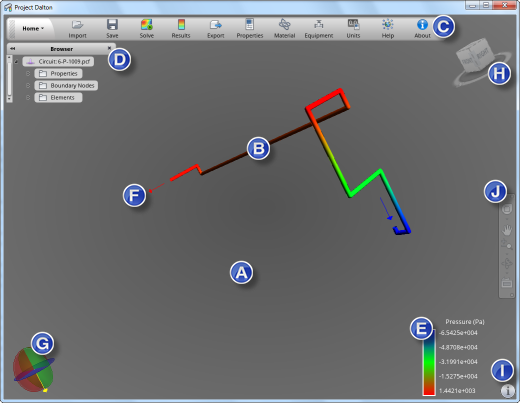
- Model view (A)
- All model interaction and visualization takes place here.
- Model (B)
-
Dalton loads a model by default when started, but you can click Import on the Home ribbon to load a model of your choice.
- Home/View Ribbon (C)
-
Click the Home/View button to display either of the two ribbons available in Dalton.
Select the Home ribbon to perform the following actions. Import a model
  Save the model
  Run the simulation
  View results
  Share your results
  Change the circuit properties
  Update the Material database
  Update the Equipment database
  Change the units
  Access the Help
  View About information on Dalton
Select the View ribbon to display or hide the following visualization tools in the Model View: Browser.
  Legend.
  Inlets/Outlets.
  Gravity widget.
  ViewCube®.
  Navigation Bar.
You can also access manipulation tools from the View ribbon. Use the Orbit tool to change the orientation of the model.
  Use the Zoom tool to change the magnification of the model.
  Use the Pan tool to move the model in the desired direction.
- Browser (D)
- The browser allows you to navigate easily through the properties, boundary nodes, and individual elements of your circuit.
- Click the arrows in the browser to expand the available categories.
Use the browser to view or modify the circuit and boundary nodes properties, access more detailed results on a section of the circuit, or to assign specific settings to an element.
Access: click
(View ribbon > Browser) to display or hide the legend in the Model view. - Legend (E)
- Use the legend to understand the values displayed on the model. Results are coded with colors, with red showing the maximum value for the selected result, and blue showing the minimum. The quantity and units appear above the legend.
- Access: click (View ribbon > Legend) to display or hide the legend in the Model view.
- Inlet/Outlet (F)
-
You can display the inlets and outlets on your model if they were defined. Inlets are displayed as blue arrows, and outlets are displayed as red arrows.
Access: click
(View ribbon > Inlet/Outlet) to display or hide the inlets/outlets in the Model view. - Gravity (G)
-
Drag the yellow arrow on the widget to specify the gravity direction.
Access: click
(View ribbon > Gravity) to display or hide the gravity widget in the Model view. - ViewCube® (H)
- Use the ViewCube to orient the model in the view.
Access: click
(View ribbon > ViewCube) to display or hide the ViewCube® in the Model view. - Information (I)
- Click this button to display the error log. If errors were encountered during the analysis, the error log is displayed automatically.
- Navigation Bar (J)
-
Use the Navigation Bar to access navigation tools, including the ViewCube® and SteeringWheels.
Access: click
(View ribbon > NavBar) to display or hide the Navigation Bar in the Model view.