Learn how to display the results in a table form and how to filter the table to only display some nodes, bars, and/or cases and to format the table. All tables use the same principles.
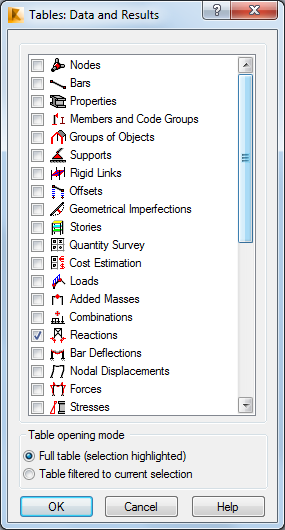
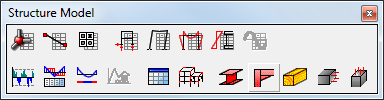
- A large number of tables are included with the software. Because they are so important you can access them in a variety of ways, including the Results tab in the Menu Bar, the Tables dialog box (View>Tables…), and the Structural Model Toolbar as shown below.
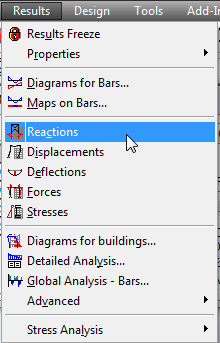
Note: The table of Reactions automatically displays when you open the Results layout. - Click the first several buttons in the toolbar to display the various tables. Note the tools that they contain and then close all but the Reactions table, which should be at the bottom of the screen.
- Once a table is open it can be filtered by loads. In the Selection toolbar, expand
 (Node Selection) and select Nodes – All.
 - Select the nodes and bars that you want to review. In this case, all Nodes (1to7) and all Bars (1to4) have been selected and Cases has been set to Simple Cases as shown below.

- To further filter the table information, right-click on the table and select Table Columns…
- In the Nodal value selection dialog box, you can specify the columns that you want to display according to the type of table. In the Reactions tab you can specify the components whose information you want to display as shown below.
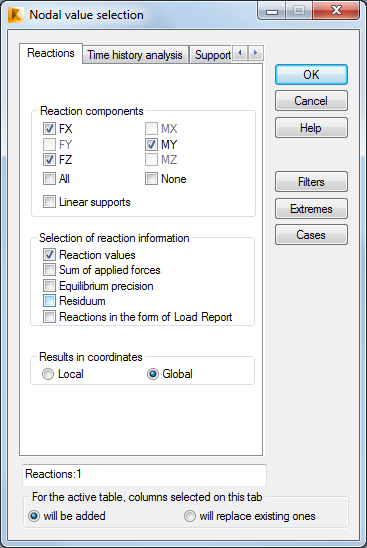
- Move the dialog box as needed to display the Reactions table. Note how the order list is by Node/Case as shown below.

- Switch to the Load Cases tab. In the Order area, click Case, object.
- Click OK. The order of the reactions is now listed by Case/Node as shown below.
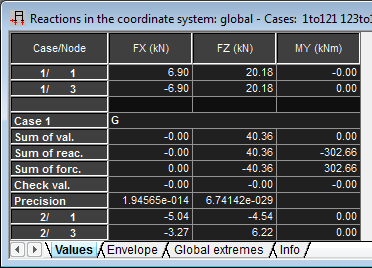
Note: Once you have set up a table with the required format, you can save the table to a template that can be used again. In the Menu Bar, select . This table view is used the next time you open the table. - In the Diagrams dialog box, clear all of the parameters to only display the structure.
- Save the project as Structure-Project-Steel.rtd.
Click here to go to the Summary.