Load-displacement plots are commonly used as a tool to determine the global stiffness response of a structure.
They are particularly useful for progressive failure analyses since they are a simple means of determining how the structure behaves as failure initiates and progresses.
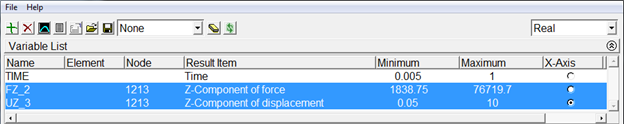
- Click Main Menu > TimeHist Postpro.
- In the dialog that appears, click the Add Data icon (green plus sign).
- Select Reaction Forces > Structural forces > Z-Component of force. Click OK.
- From the graphics window, select one of the two nodes that had the specified displacement (refer to the Define the Load section). Click OK.
- Repeat steps 2-4, but select Nodal Solution > DOF Solution > Z-Component of displacement.
- To plot the reaction force vs. displacement, set the X-Axis to UZ_3, select FZ_2, and click the Graph Data icon. Refer to the image below.
The load-displacement plot is shown below.
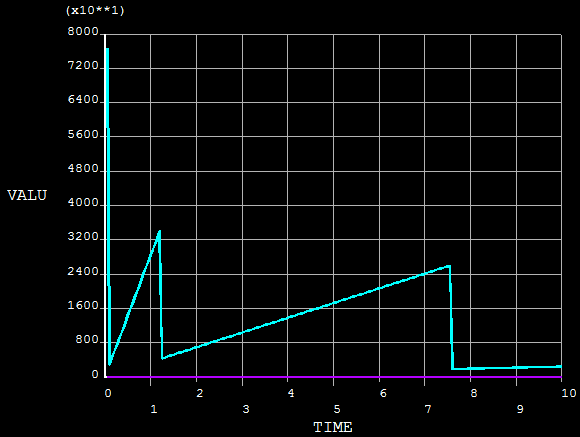
From the load-displacement plot we can see two large load drops as we displace the beam. If you plot SVAR1 and step through the loading, you see that several elements undergo cohesive damage at the time of the load drops, causing the beam to delaminate. This ultimately reduces the load carrying capacity of the beam.