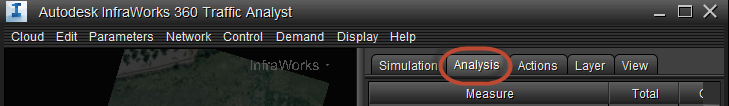
The Analysis tab in the Traffic Analyst Panel shows results calculated when the simulation preview runs. Full analysis results are generated when a simulation runs on the cloud, and these generated results files can be accessed using the asset card for the Traffic Study Area.
After completing a simulation run,
- Select the Traffic Study Area.
- Choose Traffic Analyst Panel from the Traffic Study Area right-click menu.
Wait for the panel to load and display.
- Click the Analysis tab to display the tabulated results, starting with the summary results.
Click the tabs at the bottom of the panel to see other tabulated results:
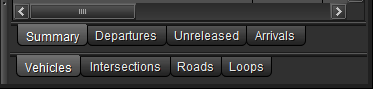
Analysis - Summary
| Completed Trip Drive Distance | The sum of all incremental movements of distance by all vehicles. This length may not be exactly the same as the length of all lanes and streams travelled, as a vehicle may not always follow the centre line of a lane or stream. |
| Completed Trip Drive Time | The sum of all time increments from the time at which the vehicle was created in the model to the time of arrival. The time of creation may be after the trip start time, due to congestion at the origin. The additional time will be recorded in the unreleased. |
| Incomplete Drive Distance/Time | Reported for all trips that have not yet arrived at the destination . |
| Unreleased Time | The sum of all time increments for vehicles which could not be released at the trip start time because of congestion at origin. |
| Extra Distance / Time | If extra people have been defined for a vehicle type, this is the sum of the distance and time for those extra people. This sum can be used to get a value for PHT and PKT for the driving part of a trip without defining person-trips. |
Analysis - Departures - Unreleased - Arrivals
These tabs show counts of vehicles arranged in a grid according to origin & destination, like demands.
| Departures | Vehicles that have successfully departed from the origin |
| Unreleased | Vehicles that were due to depart, but are blocked by congestion |
| Arrivals | Vehicles that have successfully arrived at the destination |
Analysis - Intersections
| LOS | The Level of Service: a letter from A to F, with A corresponding to low average delay |
| Delay | A time in seconds representing the average delay for vehicles in all lanes on an approach. The Level of Service (LOS) is calculated from this delay. This value is the sum of the approach delay and the acceleration delay.
|
| Maximum Queue | The maximum queue length experienced by queuing vehicles, where a queuing vehicle is one travelling at less than the queue threshold speed. The queue threshold speed is defined as 0.25 x the route speed on the first link of the approach. The queue delay is a rolling average value, updated every second. |
Analysis - Roads
| Vehicles | Count of vehicles that have completed the link |
| People | Count of all people in vehicles counted above |
| Mean Time | Mean travel time for the link |
| Mean Flow | Mean flow calculated from count of vehicles in measurement period |
| Mean Speed | Mean speed calculated from travel time and link length |
| Mean Density | Mean density, calculated from mean entry interval time over mean travel time |
| Density | Instantaneous density, calculated from number of vehicles on all lanes of road divided by length of road |
Analysis - Loops
| Occupancy Time | Instantaneous occupancy time. Zero if unoccupied |
| Non-occupancy Time | Instantaneous gap time. Zero if occupied |
| Occupancy Ratio | Ratio of total occupancy time to total time |
| Non-occupancy Ratio | Ratio of total non-occupancy time to total time |
| Flow | Flow calculated from count of vehicles between first and last event |
| Vehicles | Count of vehicles passing loop |
| People | Count of people in vehicles passing loop |
| Headway | The headway in seconds) between the last two vehicles, measured head to head |
| Gap | The head-to-tail gap (in seconds) between the last two vehicles (headway minus vehicle length/speed) |
| Vehicle Length | Mean vehicle length |
| Density | Density calculated form mean vehicle length |
| Gap Speed | Speed calculated from occupancy and mean vehicle length |
| Gun Speed | Mean of instantaneous speeds of vehicles at loop |