Animate XY plot
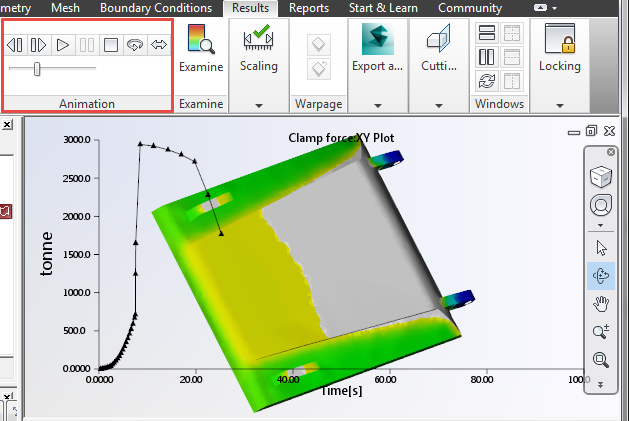
You can now animate an XY plot through time. More than that, you can animate an XY plot when it is overlayed with another result that is animated through time. In fact, you can even overlay a result, that is animated through time, with multiple XY plots. This feature enables you to visually compare results in time.
- Select the first result.
- Hover over the 2nd result, click the right mouse button and select Overlay.
- Click
 () to animate the overlaid results.
The animation variable range and step length are determined by the overlaid plot, and the range can be adjusted by modifying the property of the overlaid plot. If the length of the overlaid is shorter than that of the original plot increase the length of the overlaid plot.
 ().
(). - If the overlaid plot is a result plot, select the Animation tab and extend the Animate result over range.
- If the overlaid plot is an XY plot, select the XY Plot Properties (2) tab and change the X range
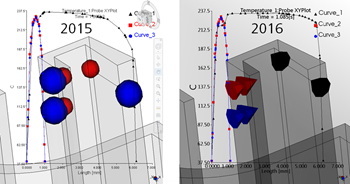
Improved Probe XY-Plot Markers
The on-screen markers which indicate the selected locations for Probe XY-Plot curves are now color coded to match the colors of their respective XY curves. In addition, the shaping of the makers now also indicates the probe direction.