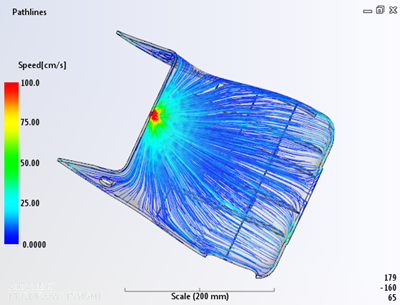
The Pathlines plot enables you to trace the path that selected fluid particles have taken, so you can gain a deeper understanding of their history. With this plot, you can answer questions such as, which gate the fluid particles entered from, how far they traveled before they froze, or the path they took through a complex geometry.
- Pressure
- Temperature
- Shear rate
- Time
- Speed
 3D
3D
- Thermoplastics injection molding,
- Thermoplastics overmolding,
- Reactive molding.
The initial view of the pathlines plot is a trace of pathlines from the injection location(s) through the entire part.
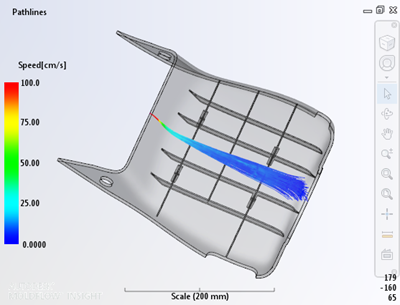
If you want to plot the pathlines of only those fluid particles that have reached a specific location in the mold, switch from From injection location(s), to Terminating in selected area, and select the specific area.
The controls in the Tools tab enable you to change various aspects of the plot, including:
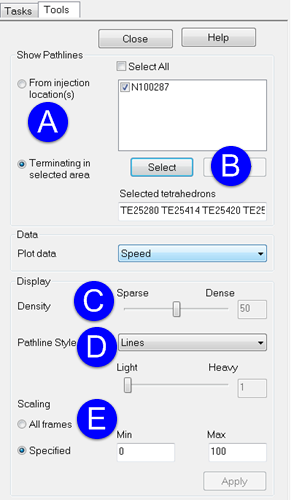
- A. which pathlines you want to see
- B. the area you would like to view
- C. the density of the pathlines
- D. the style of the pathlines: lines, markers or tubes
- E. scaling