Right-click on Displacement in a subcase and select Edit.
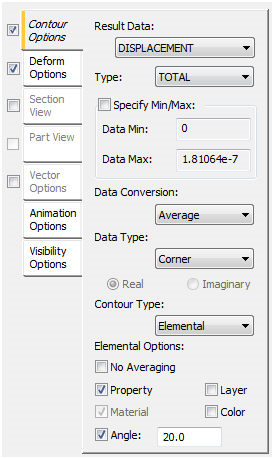
The Contour Options tab has the following main sections:
-
Result Data:
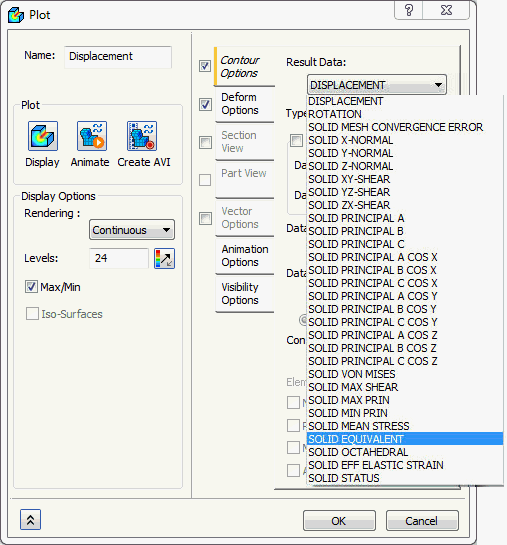
Solid Model
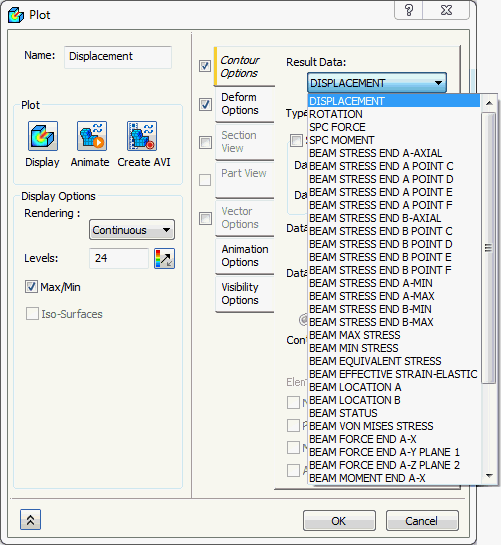
Bar Model
- The above figures illustrate the different types of result data available for a solid mesh and bar mesh linear static analysis.
- The results available change based on element type, analysis type etc.
-
Component:
- Depending on the Result Data, a choice of a component can be displayed in the contour plot, such as TX for Displacement.
-
Data Min/Max fields:
- You can adjust the values in these fields to custom numbers which can be convenient by checking Specify Min/Max.
- The contour plot colors adjust accordingly.
- All contour areas above the maximum value will be red and below the minimum value will be blue.
-
Data Conversion:
- There are three options to convert the data: Average, Max and Min.
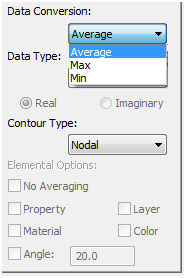
- If Average is selected, an average of the surrounding values will be used to obtain results, whereas Max and Min will use the max or min values, respectively, of the surrounding locations.
- The Min option should only be used when performing contours for vectors where the minimum values are actually the worst case (i.e. factor of safety or large compressive stresses).
 If there is a large difference between the three results (Average, Max and Min), especially at locations that do not have sharp corners or breaks in the model, your model may require a finer mesh.
- There are three options to convert the data: Average, Max and Min.
-
Data Type:
- This section controls how results are converted from pure data at element centroids and corners to the actual contour plot.
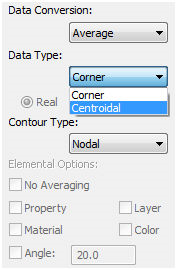
- Corner: Uses corner element data to plot the stresses which typically results in a smooth contour.
- Centroidal: Uses the center element stress to plot the stresses resulting in a discontinuous contour.
- Magnitude/Phase or Real/ Imaginary: In the case of a frequency response analysis, you will be given the option of magnitude / phase or real / imaginary data.
- This section controls how results are converted from pure data at element centroids and corners to the actual contour plot.
-
Contour Type:
- This section allows you to pick between either nodal or elemental contouring.
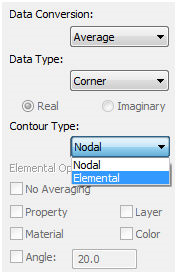
- Nodal: This contour type averages all values at the nodes and cannot account for any discontinuities in material or geometry. This produces a relatively smooth contour but loses its accuracy at material boundaries or property breaks.
- Elemental: This contour type allows you to specify which discontinuities in the model to use in the contouring to obtain an accurate representation of the results. This type of contour is most useful when a model has multiple materials or it is made with plates that intersect at large angles or have varying thickness. Elemental contouring may not be smooth, but is more accurate. Using this type of contour also allows you to view both top and bottom results on one plot.
- This section allows you to pick between either nodal or elemental contouring.
-
Elemental Options:
- This section controls the averaging of elemental contouring. This option is only available when the Elemental Contour Type is selected.

- If No Averaging is selected, the contours of the elements will be created without consideration to any of the other elements. This provides a very choppy plot but is useful in variable thickness plate models. This is also useful because it only plots the pure data; no averaging has taken place so you are looking at the numerical results only.
- If Property is selected, the Material option will be grayed out because property is more discrete than materials. This is because you typically do not want to average across material or property boundaries.
- Material can be used as a break. Again, this is only available when Property is not selected.
- If Angle is selected, you must also enter a tolerance. This is important with plate models that have intersecting edges because you would not want to average stresses of plates that intersect at right angels.
- If Layer or Color is selected, you may separate your model into specific key areas based on layers or colors.
- This section controls the averaging of elemental contouring. This option is only available when the Elemental Contour Type is selected.