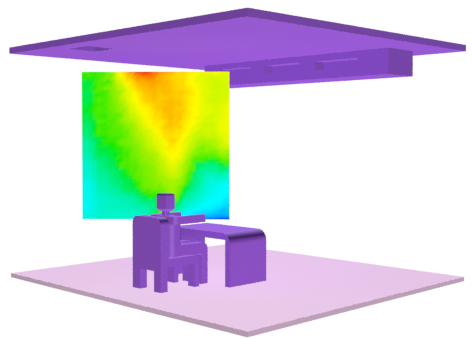
You can visualize data from a CFD simulation as vertex colors on geometry in the scene. For example, you use a subdivided plane to see a slice of the temperature, pressure, or speed fields as a color gradient.
- Import a Simulation CFD file as described here.
- Add an object like a plane, and make sure it has enough subdivisions to show the data as a smooth gradient.
- Transform the object into the position and orientation that you want to visualize within the CFD data. You can also move the object after you apply the visualization modifier, but the interaction may be slower.
- With the object selected, choose one of the following from the
menu:
- MCG Visualize CFD Pressure
- MCG Visualize CFD Temperature
- MCG Visualize CFD Velocity (speed)
- When you are prompted to do so in the status bar, pick the CFDImportData object in the scene.
A CFDVertexPaintChannel modifier (for pressure or temperature) or CFDVertexPaintVelocity modifier (for velocity/speed) is applied to the object. In addition, its object properties are set to display vertex colors in the viewports and a material is applied to render the vertex colors.
- On the
Modify panel, adjust the
Color Mapping settings as desired:
- Nb. Vertices is the number of nearby CFD data points to sample per vertex.
- Smoothing controls the weighting of the nearby CFD data points: 1.0 gives a linear falloff, 2.0 gives an inverse-square falloff, and so on.
- Local Normals controls the range of the color gradient from blue to red. When it is on, blue corresponds to the minimum value and red to the maximum of the values displayed on the object. When it is off, they correspond to the minimum and maximum values in the whole CFD data set.
Note: To visualize a different CFD data set, click the button in the
CFD Data group box and pick another CFDImportData object. You can also switch between visualizing temperature and pressure. If the colors don't update, toggle
Update Caches on and off.