This topic describes how to create a custom box-creation tool with Max Creation Graph. You then modify the tool to position the object on the home grid. After that, you use the graph to create a compound node, which you assign to a category. You finish by packaging the tool to create a file you can distribute to other 3ds Max users.
You'll also find in this topic a number of useful tips for working with Max Creation Graph, such as how best to use folders and how to uninstall MCG tools.
Example: Get started with Max Creation Graph:
- Open the graph editor: On the menu bar, click the Scripting menu to open it, then choose Open Max Creation Graph. (If using the enhanced menus, it's on the Script menu.)
You'll start your graph at the end, with the node that generates the geometry the graph defines.
- In the Available Nodes/Operators list on the left side of the editor window, scroll to the Outputs category, expand it, and drag an Output: geometry node into the graph window, near the right side.
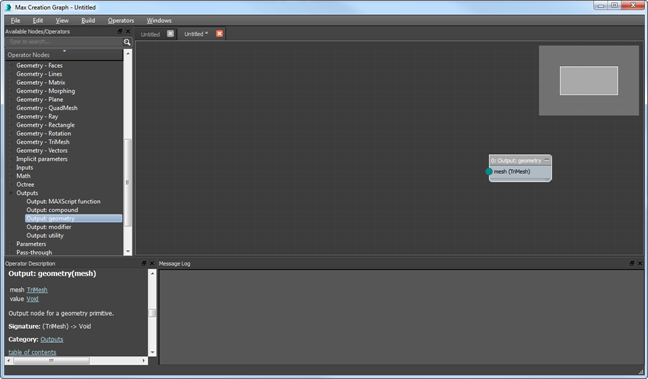
This node will generate the result of the remainder of the graph. Graphs typically flow from left to right.
Next you'll add the first node in the graph.
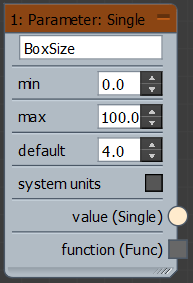
- Expand the Parameters category in the Available Nodes/Operators list and drag a Parameter: Single node into the graph window, near the left side. Double-click the text field (currently reads "name"), edit the text to read BoxSize, and press Enter.

Parameters appear in the interface of the graph output (in this case, with the label BoxSize), and enable users of your graph to enter values in the interface. The Parameter: Single node lets the user specify a single-precision floating-point number; that is, a decimal fraction. As the designer of the graph, you can also limit user input to a specific range of values, and specify a default value.
You could keep the default value of 0.0, but it would make more sense to use a starting size that produces a visible object.
- In the "default" field, enter 4.0. Keep the default "min" and "max" values of 0.0 and 100.0.
You now have the start and the end of the graph, representing input and output, respectively. All that remains is to add a processing node, and to wire the nodes together to form a graph.
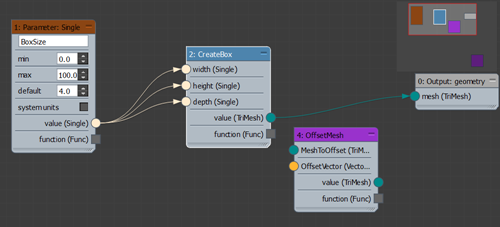
- Expand the Geometry - Trimesh category and drag a CreateBox node into the view. Place it between the two existing nodes.
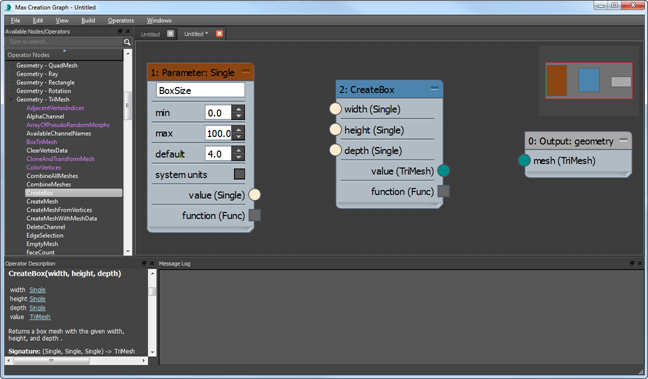
The CreateBox node takes three floating-point values as inputs, and outputs a box-shaped TriMesh (triangle-based mesh) object. Thus it has three beige-colored input connectors on its left side, for the three dimensions of the box, and a single teal-colored output connector on the right side. Note that the color of the Parameter: Single node's output connector matches that of the CreateBox's input connectors, indicating that the connectors use the same type of data. Likewise for the CreateBox's output connector and the Output: Geometry node's input connector.
- Drag between the Parameter: Single node's output connector, value (Single), and the width (Single) input connector of the CreateBox node. The direction you drag doesn't matter.
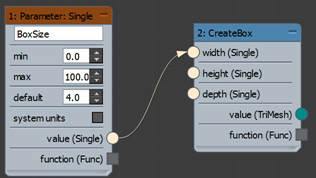
The result is a wire from the first node to the second. The wire uses the same color as the connectors it's wired between, and the arrow on the wire indicates the data flow direction.
- Similarly, wire the Parameter: Single value (Single) connector to the height (Single) and depth (Single) input connectors of the CreateBox node.
The result is three wires going from the Parameter: Single node's single output to each of the CreateBox node's three inputs. This means that the one value from the Parameter: Single node will be used for all three of the box's dimensions, thus producing a cube. If you wanted to use different values, you could just add two Parameter: Single nodes and wire them separately to the CreateBox node's inputs.
The next step is to convert the raw data produced by the CreateBox node to a geometry node that 3ds Max can work with.
- Wire the value (TriMesh) output connector of the CreateBox node to the mesh (TriMesh) input of the Output: Geometry node.

- To use the graph output, it's necessary to first validate and then evaluate the graph. You can validate the graph manually, but saving it performs the validation automatically, which simplifies the process. Press Ctrl+S and save the file in the Tools\ folder inside the default path as MyBox.maxtool. Important: The first time you save a graph in MCG, the default path is [install drive]:\Users\[user name]\Autodesk\3ds Max [version number]\Max Creation Graph\. For example, if your user name is "Simone," and Autodesk 3ds Max 2017 is installed on drive C, the default path would be C:\Users\Simone\Autodesk\3ds Max 2017\Max Creation Graph\. If you change this path, MCG remembers the new path and uses it thereafter.
If you want your MCG tools to persist between 3ds Max sessions, save them in the Tools\ folder inside the Max Creation Graph\ folder. So using the preceding example, you would save it in C:\Users\Simone\Autodesk\3ds Max 2017\Max Creation Graph\Tools\.
After you save the MyBox graph, the Message Log window of the graph editor shows that validation, generation of the resultant MAXScript, and saving were all successful.
- Open the Build menu and choose Evaluate. The Evaluate function builds the graph and adds it to the 3ds Max interface.
The Message Log window of the graph editor shows that validation, generation of the MAXScript file, and evaluation of the MAXScript file were all successful.
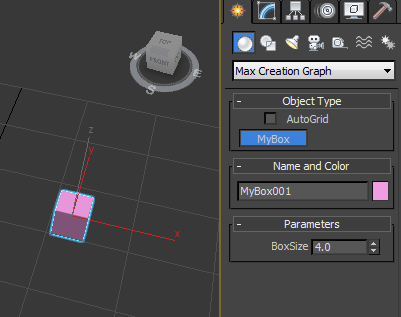
- When you evaluate a geometry graph successfully, its output appears by default in the Max Creation Graph category of the Create panel. Go to the Create panel, open the drop-down list and choose Max Creation Graph. Then, on the Object Type rollout, click the MyBox button.
The Parameters rollout appears on the Create panel, with a single BoxSize parameter. Its default value is 4.0, which will produce a small box.
- Click in a viewport to add a box, then adjust the BoxSize parameter value to change the box's size.
Congratulations: You've just created your first MCG graph!
Tip: As mentioned in the preceding note, saving your graph in the Tools\ folder ensures that your tools persist between sessions. If you like, check this now by exiting and restarting 3ds Max.To remove an MCG tool from the interface, first exit 3ds Max, use a file browser to navigate to the Tools\ folder and delete the files that use the file name for the tool. In this example, you would delete MyBox.maxtool, MyBox.ms, and MyBox.txt (the latter file is created the first time you use the tool). Copy the files to another folder outside the Tools\ folder as a backup, then delete them from the Tools\ folder and restart the program.
- Click in a viewport to add a box, then adjust the BoxSize parameter value to change the box's size.
Create the box on the home grid:
- Proceed from the preceding procedure, or open the MyBox.maxtool graph you saved earlier.
One way to reposition the box is with an offset-type node.
- In the Operator Nodes list to the left side of the editor window, expand the Geometry: Trimesh category, if necessary, and drag the OffsetMesh node into the graph. Position it between the CreateBox and Output: Geometry nodes.
You'll use this node to reposition the mesh on the Z (vertical) axis.
Tip: A Compound is a special type of node that contains an MCG graph. It's denoted by purple coloring in the Operator Nodes list as well as in the Compound node's header. To see a Compound node's makeup, right-click the node in the graph or Operator Nodes list and choose Open Compound In New Tab.Compounds can even be nested. The OffsetMesh graph contains another Compound: DeformMeshPoints.
At this point, you could wire the OffsetMesh node to the CreateBox and Output: Geometry nodes in two different actions, but instead you'll use a shortcut.
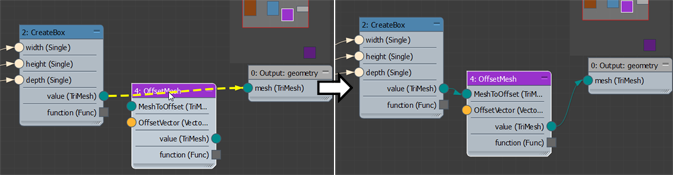
- Press and hold Ctrl, then drag the OffsetMesh node to the wire between CreateBox node's output and the Output: Geometry node's input. When the wire changes to a dashed yellow line, drop the node and release Ctrl.
MCG automatically inserts the new node between the two existing ones, using the correct TriMesh connector types on both sides.
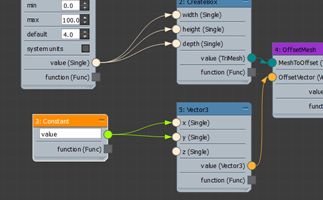
The other OffsetMesh node input (orange connector) is OffsetVector, which lets you specify the object offset in three dimensions, and thus requires a Vector3 input type. In the next step, you'll use a convenient feature to add the requisite node without having to find it in the Operator Nodes list.
- Drag from the orange OffsetVector connector on the left side of the OffsetMesh node to an empty spot in the graph editor, and release the mouse button.
A small search list opens next to the mouse cursor, with a list of nodes that have output connectors compatible with the Vector3 input connector type. Most of these have output types Any, which is compatible with most other types. In this case, we'll use a connector directly compatible with the Vector3 input.
- On the keyboard, type V (the case doesn't matter).
MCG narrows down the available choices to nodes that start with "V".
- In the list, click the Vector3 node.
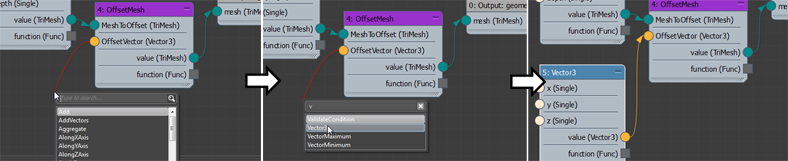
The new Vector3 node appears in the graph, wired to the OffsetMesh node's OffsetVector connector.
Next you'll provide value inputs for the Vector3 node. You'll be offsetting only the Z-axis position, so you can simply set X and Y to 0.
- In the Operator Nodes list, expand the Constants category and drag a Constant node into the graph, to the left of the Vector3 node. Wire its Value output connector to both the X and Y inputs of the Vector3 node.
 Note: A Constant node, like a Parameter node, provides a value input to the graph. The difference is that with a Constant node, the value setting isn't readily available to the user of the graph; only to its author.
Also, the Constant node's output connector is green, indicating that it is of type Any. This means that it can output any type of numeric value (integer, float, and so on) and is compatible with all input connectors that require numeric values.
- Set the Value field of the Constant node to 0.0. Important: Entering the value as a decimal fraction tells MCG that this number is to be treated as a float, not an integer, as it would be if you simply specified 0.
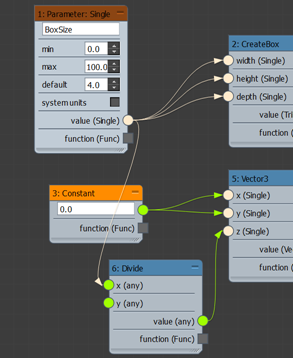
Next you'll use a simple calculation to specify the Z value. By default, the box is positioned halfway down into the home grid, so you want to raise it by half its height. You'll calculate the offset with division, using an arithmetical node.
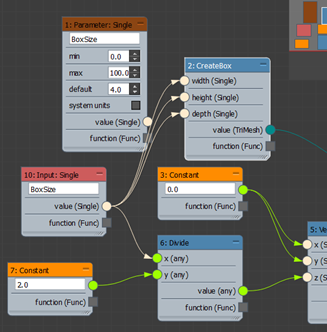
- Use any method you've learned to add the Divide node to the graph (it's in the Math category). Position it to the left of the Vector3 node and wire its Value output to the Z input of the Vector3 node.
Divide has two inputs of type Any: X is the numerator and Y is the denominator. In other words, the output of Divide is the X input divided by the Y input. You already have the numerator: BoxSize.
- Wire the Value output of the BoxSize Parameter node to the X input of Divide.
You'll need another Constant node for the denominator. You can create this by cloning the existing Constant node.
- Shift+drag the Constant node downward a bit, which makes a duplicate of the node. Drop the copy near the Divide node, change its value to 2.0, and wire its output to the Y input connector of Divide.
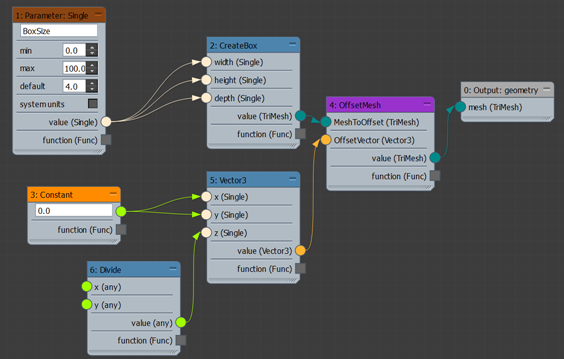
At this point, your graph might be a bit messy; this is easy to fix.
- Right-click in the graph window and choose Lay Out All.
This straightens up all the nodes.
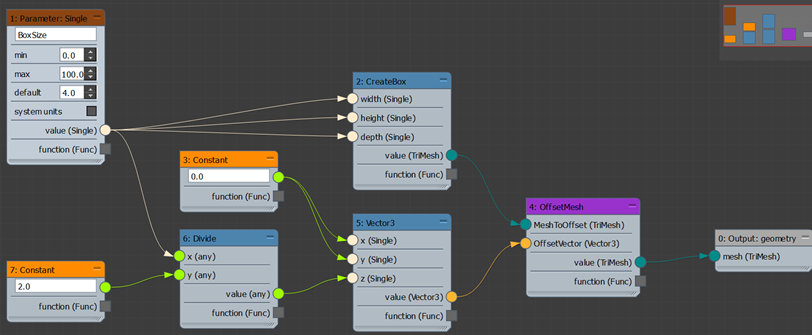
- Save the graph and evaluate it.
This replaces the MyBox tool on the Object Type rollout of the Max Creation Graph category.
- Use the MyBox tool again to create a new box.
Now when you adjust the BoxSize value, the bottom of the box stays on the grid.
In the preceding procedure, you learned to design a graph that creates a resizable cubic box. You might have noticed that, unlike the standard Box primitive, the procedural-content box sits not on the home grid but is centered on it vertically, so that half of it is above the grid and half is below. In the next procedure, you'll add logic to replicate the standard Box primitive creation process more closely, creating an object that sits on the grid rather than in it.
Create a compound node:
- From the Inputs category, drag an Input: Single node to the left side of the graph. Edit the text field to read "BoxSize". Wire the Value output of the new node to the three inputs of the CreateBox node and to the X input of the Divide node.
- The Parameter node is now unwired, so you can select it and delete it (press the Delete key).
Similarly, you'll replace the current Output node with one designed for sending data out of a compound node.
- From the Outputs category, drag an Output: Compound node to the right side of the graph. Connect the Value output of the OffsetMesh node to the Output: Compound input, then delete the Output: Geometry node.
Next you'll save the compound using a special file format in a dedicated location. But first you'll specify where it appears in the Operator Nodes list.
- In the Max Creation Graph dialog, open the Edit menu and choose Edit Graph Properties.
The Graph Properties opens, with various fields you can use to describe the graph. The one you'll use in the next step is the Category field, outlined in the following illustration.
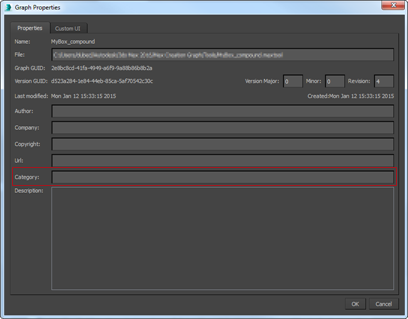 Note: Most of these settings simply help to keep track of various aspects of your graph, but the Category field has an actual, functional effect.
- In the Max Creation Graph dialog, open the Edit menu and choose Edit Graph Properties.
- In the Category field, enter the name of the category from the Operator Nodes list that the compound should appear in. For this example, enter Geometry - TriMesh. Tip: You can specify any category you like, including a new one. If you don't specify a category, the compound appears in the Compounds category.
- Open the File menu and choose Save As. Use the file dialog to navigate to the Compounds folder: [install drive]:\Users\[user name]\Autodesk\3ds Max [version number]\Max Creation Graph\Compounds\, and choose the file type MCG Compounds (*.maxcompound) from the Save As Type drop-down. Save the graph in the Compounds folder as MyBox.maxcompound.
- Open the Operators menu and choose Reload Operators.
This adds the MyBox operator to the Geometry - TriMesh category.
Tip: As you might have noticed, Reload Operators also has the side effect of collapsing all expanded categories in the Operator Nodes list. - Near the top of the editor dialog, right-click next to the MyBox.maxcompound tab and choose Create New View.
A new, empty tab labeled "Untitled" opens.
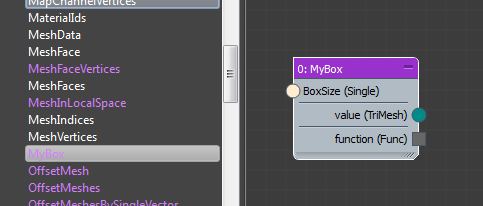
- Expand the Geometry - TriMesh category and drag the MyBox compound node into the empty view.
The input connector uses the BoxSize label you entered in the Input: Single node.
- From the Parameters category, drag a Parameter: Single node to the left side of the graph. From the Outputs category, drag an Output: Geometry node to the right side of the graph.
- Change the text field in the Parameter: Single node to Size, and wire the two nodes to the input and output connectors of the MyBox compound.

- Save the new graph in the Tools\ folder as SimpleBox and then evaluate it.
- Use the SimpleBox button on the Object Type rollout of the Max Creation Graph category to create a new box.
A compound node is a self-contained node built up from other nodes. In a sense, it's a "black box" whose inner workings are hidden, by default, from authors who use it. Once you've created a compound, you can save time by using it in graphs in the place of the graph it contains.
Because a compound doesn't work as a complete graph, it's necessary to replace two nodes.
You'll start by replacing the Parameter node at the start of the graph with an equivalent Input node. That way the input value (BoxSize) will be provided by the graph of which the compound is a part, rather than from within the compound.
Create, install, and uninstall a Max Creation Graph package:
- With the SimpleBox graph open, open the File menu and choose Package Max Creation Graph.
- Use the file dialog to save the package file as SimpleBox.mcg.
For best results, save the file in the default folder ([install drive]:\Users\[user name]\Autodesk\3ds Max [version number]\Max Creation Graph\Packages\) and have teammates to whom you distribute the package file place it in the analogous location on their machines.
In the next step, you'll simulate the process of installing a tool by a teammate. There's no need to use the graph editor for this process.
- Close the graph editor, then open the Scripting menu on the main menu bar. (If using the Enhanced Menus workspace, use the Script menu.) Choose the Install Max Creation Graph (.mcg) Package command and open the package file you saved in the preceding step.
An alert opens with the information that the installation succeeded. Click OK to continue.
- From the Create panel > Geometry drop-down, choose Max Creation Graph.
The SimpleBox tool appears on the Object Type rollout.
- Use the tool to make sure it works properly.
Last, you'll learn how to uninstall a package. There isn't an official "Uninstall" function, so you'll use an alternative method.
- First, quit 3ds Max. Then, using a file manager utility such as Windows Explorer, navigate to [install drive]:\Users\[user name]\Autodesk\3ds Max [version number]\Max Creation Graph\Tools\Downloads\.
If you can't find this folder, just search your system for filenames analogous to those in the next step.
- Find and delete the three files with the name of the tool. In this case, they would be SimpleBox.maxtool, SimpleBox.ms, and SimpleBox.txt. Tip: As you can see, when you install a package, the corresponding graph (.maxtool file) becomes available, so you can edit it if necessary.
- Restart 3ds Max and check the Max Creation Graph > Object Type rollout on the Create panel.
The previously installed package is no longer available. You still have the tool file, so it's a simple matter to reinstall the tool if necessary.
A Max Creation Graph package is a self-contained software component that any Autodesk 3ds Max 2017 user can install and use without necessarily being familiar with its inner workings. For example, if you design a graph to create a particular type of procedural object, such as a chair with customizable features, you can then use this facility to distribute the graph to the rest of your team so they can create similar types of objects.