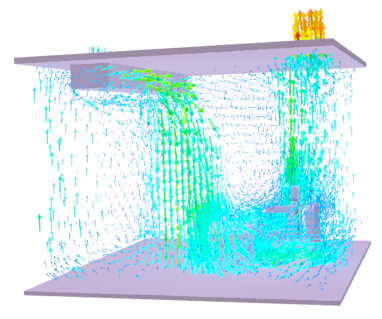
You can visualize the velocity field of a CFD simulation as arrows whose length and color are determined by the speed at the corresponding position.
- Import a Simulation CFD file as described here.
- Choose .
- When you are prompted to do so in the status bar, pick the CFDImportData object in the scene.
A CFDVelocityField object is created, containing the arrows' geometry.
- On the
Modify panel, adjust the CFDVelocityField object's
Appearance settings as desired:
- Arrow Scale% scales the base arrow length, up to Max Length.
- Normalized Length sets all arrows to Min Length, before Arrow Scale% is applied.
- Min Length sets the minimum length used for the slowest arrows, before scaling.
- Max Length sets the maximum length used for the fastest arrows, after scaling.
- Red Amount% controls the color gradient from blue (slowest), through cyan, green, yellow, orange, and red (fastest). Values above 100 shift the slower arrows toward red, and values below 100 shift the faster arrows toward blue.
Note: To visualize a different CFD data set, click the button in the
CFD Data group box and pick another CFDImportData object.