 The mesh compare feature is available in the Extras menu Compare two meshes or also with the button Keep and compare in the dialog that pops up after you have applied a repair. In this feature, you can compare two similar models (after you have edited or fixed them) for their differences and find out if they lie within your tolerances. These will be made visible in terms of colors and numbers. First, select two parts that you want to compare. They need to be located on the exact same geometrical position in Netfabb. The simplest way to do this is to move them both to the origin or to keep the original part after editing or repairing it.
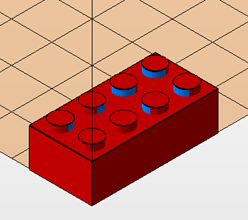
Parts that shall be compared must have the same position, like these two bricks: the original blue part and the changed red part.
When you choose the compare feature, a dialog opens where you can choose which parts you want to analyze. If you have selected two parts before, then they are preselected in this dialog. Decide which part you want to examine: The Comparison part is usually the new, changed file. Next decide on the Compare Direction in the dropdown menu. Unidirectional comparisons usually save a lot of time, when working on larger objects. Then click on compare.
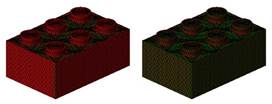
The reference part will be colored green/red. If you choose the Comparison part in the tabsheet on the right, it will be colored green/blue. Blue/red marked areas have a comparatively large distance to the respective areas on the other part: there are the most significant differences. In the tabsheet the exact numbers of the differences are listed: from the minimum, average and maximum distances you can see if the changes are within your tolerance limits.
For visualization, you can choose from which threshold on you want the areas to be marked red/blue: You can define what differences are acceptable for you and only mark red/blue what’s above this value.
In the visualization you can choose if you want to show a color gradient and a triangle mesh, if you want to highlight the edges where the distance to the original shape is most striking or show the part transparent to get a better view of inner surfaces. The scale on the right helps you estimate the distances as they are displayed with help of the color gradient and the maximum positive and negative deviations. If you check the option Align Meshes both parts will be aligned stacked over each other, for a visible comparison possibility.
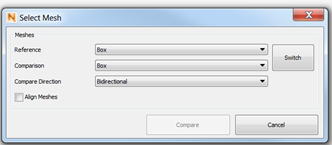
In the compare module: Select in this dialog, which model should be checked for changes and the compare direction. The differences will be made visible on the comparison part.

 Add/remove measurement points helps you determine specific deviations of the compared parts. Click any spot on the mesh you want to measure and the exact distance will be displayed.
In the second tabsheet Bar chart you find listed, how many areas of a part have a specific distance to the original part. So one bar stands for a distance and the bar’s height displays, how often this distance occurs.
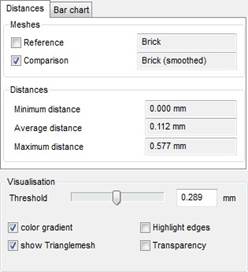
See the minimum, average and maximum distance in this tabsheet and check if the differences are within your tolerance limits.
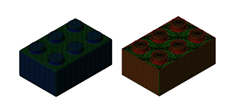
Left: On the comparison part the most significant differences are marked blue. Right: On the Reference parts, these areas are marked red.
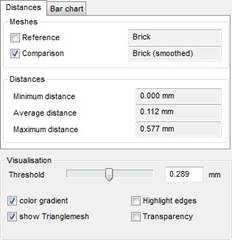
Make visualization changes in the tabsheet. You also see the minimum, average and maximum distance.
Left: A very low value was defined as threshold. Right: With a higher threshold value, smaller differences on the part remain green and therefore are marked as acceptable.
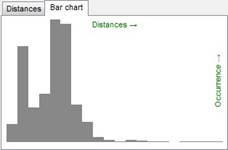
The bar chart visualizes how often a specific strength of change occurs.
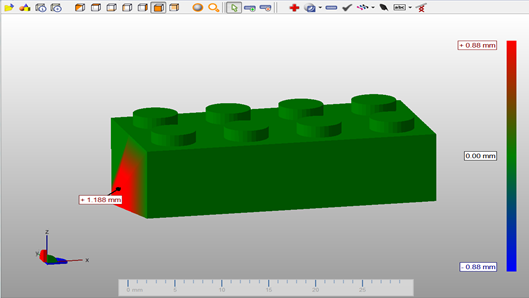
The scale on the right helps to convert the color gradient into numeric distances. You can also determine single deviations with the add measurement points tool.