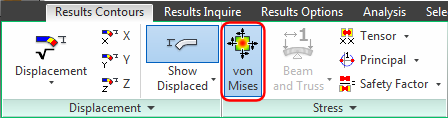
In this step, we examine the von Mises Stress values on the spring clip.
- Click
von Mises from the Stress panel to display stress on the assembly.
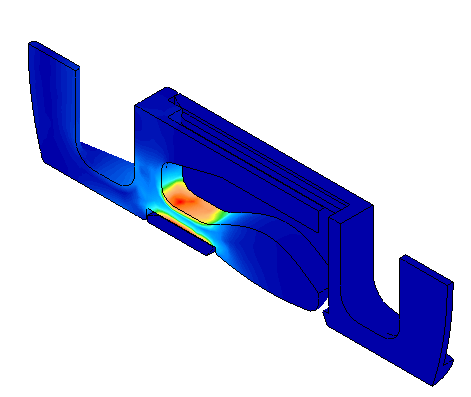
You should see this...
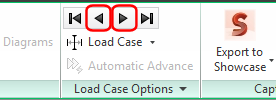
- Step backwards and forwards through the Time Steps (Load Cases) to determine when the maximum stress occurs. Click
Results Contours
 Load Case Options Previous or
Next while watching the legend. Stop at the Time Step with the maximum Von Mises stress result.
Load Case Options Previous or
Next while watching the legend. Stop at the Time Step with the maximum Von Mises stress result.
- Write down the maximum Von Mises stress value shown in the legend and the Time Step number shown in the annotation (lower left corner of the display area). Your results should look similar to the following image:
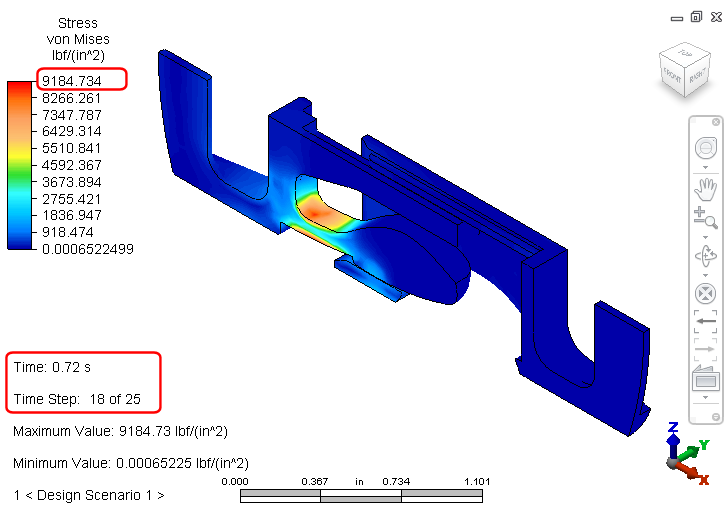 Note: Your results may indicate a different time step or Von Mises stress value. Be sure to record the time step number and stress that you see in your results.Tip: You could have used the command, Results Inquire Inquire Maximum Results Summary to locate the maximum stress, time step, and the number of the most highly stressed node. However, the values in this summary are based on
unsmoothed results. There are multiple calculated results at each node, one for each element that shares the node. The maximum of all of the values at a given node is reported by the
Maximum Results Summary. However, by default, the legend and stress contour plot are based on the
average of the stresses at each node (this is the default smoothing method). Therefore, the stresses in the
Maximum Results Summary
do not agree with the values in the legend. Also, the maximum stress for unsmoothed results may occur at a different location and time than the maximum smoothed stress. Other tools in the
Inquire
panel of the
Results Inquire
ribbon tab only show results for the currently displayed time step.
Note: Your results may indicate a different time step or Von Mises stress value. Be sure to record the time step number and stress that you see in your results.Tip: You could have used the command, Results Inquire Inquire Maximum Results Summary to locate the maximum stress, time step, and the number of the most highly stressed node. However, the values in this summary are based on
unsmoothed results. There are multiple calculated results at each node, one for each element that shares the node. The maximum of all of the values at a given node is reported by the
Maximum Results Summary. However, by default, the legend and stress contour plot are based on the
average of the stresses at each node (this is the default smoothing method). Therefore, the stresses in the
Maximum Results Summary
do not agree with the values in the legend. Also, the maximum stress for unsmoothed results may occur at a different location and time than the maximum smoothed stress. Other tools in the
Inquire
panel of the
Results Inquire
ribbon tab only show results for the currently displayed time step.
- Write down the maximum Von Mises stress value shown in the legend and the Time Step number shown in the annotation (lower left corner of the display area). Your results should look similar to the following image:
- Click
 Results Inquire Probes Maximum to mark the most highly stresses node with a probe.
- Click
 Results Inquire Probes Minimum Maximum Nodes to add the node number to the
Maximum
probe. (This command is located in the expanded portion of the
Probes
panel, which appears when you click the panel name.
Results Inquire Probes Minimum Maximum Nodes to add the node number to the
Maximum
probe. (This command is located in the expanded portion of the
Probes
panel, which appears when you click the panel name.
- Plot the Von Mises stress results versus time at the most highly stresses node:
- Select the node at the point of the
Maximum
probe.
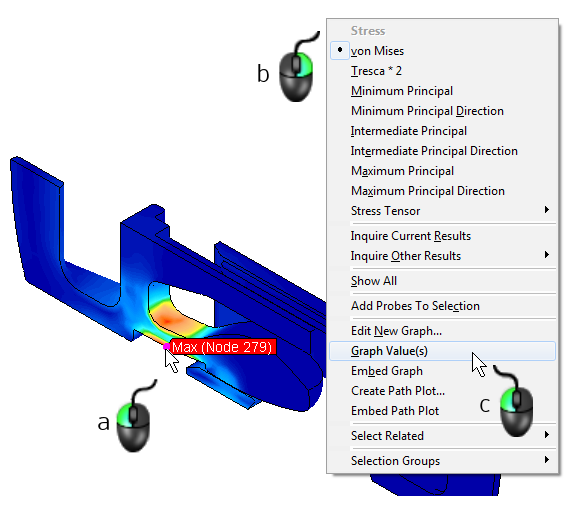
- Right-click anywhere in the display area.
- Select the Graph Value(s) command. A new graph window appears.
- Select the node at the point of the
Maximum
probe.
- Use the following image as a guide for the next two sub-steps:
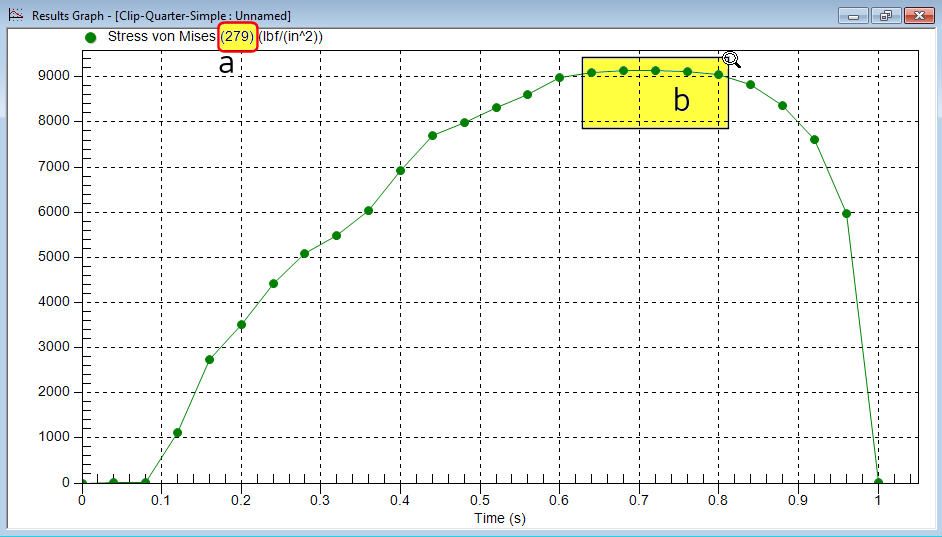
- Confirm that the node number shown above the graph matches the number that was shown on the Maximum probe (to ensure that you clicked on the intended node).
- Click and drag to draw a rectangle enclosing only the five data points with the highest values. This action zooms into the specified portion of the graph.
- Add data point labels and make them easier to read by completing the following three sub-steps:
- Right-click in the graph area and choose Include Data Labels.
- Right-click in the graph area again and choose
Font Size Large.
- Right-click in the graph area one more time and choose
Grid Options Hide Grid Lines. The graph should now look like the following image:
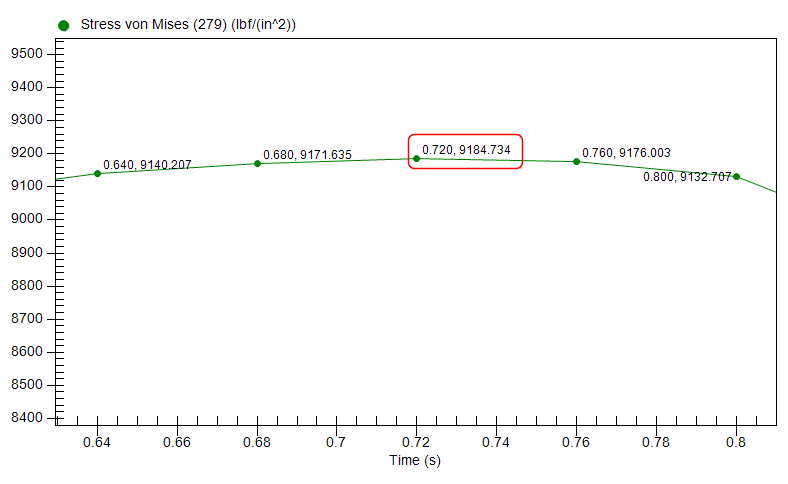
Notice that the time and stress values at the peak data point match the values we viewed previously in the contour plot legend and annotation.
- To close the plot, click the "X" in the upper right corner of the graph window.
- Click
Results Inquire Probes Maximum to deactivate the
Maximum
probe.
- Click in a blank part the display area to clear the previously selected node.