In this exercise, you will convert AutoCAD elements to land plots with automatic labels that show useful topological data, such as land area.
Plot layout tools are available to create and edit plots with precision. You will learn more about the Plot Layout tools in later AutoCAD Civil 3D tutorial exercises.
Create plots from existing AutoCAD objects
- Open drawing Plot-1A.dwg, which is located in the tutorials drawings folder.
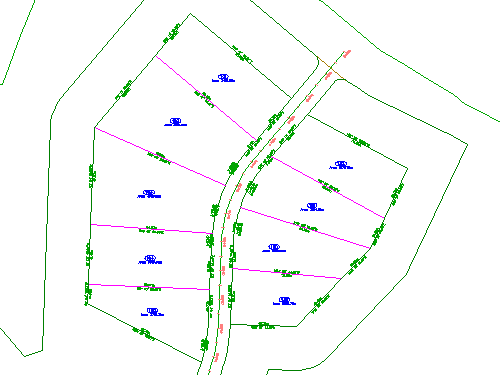
This drawing contains an existing ground surface, alignments that represent intersecting road centerlines, and AutoCAD lines and arcs that represent property boundaries. In the following steps, you will create AutoCAD Civil 3D plot objects from the existing lines and arcs.
- Click tab
 panel drop-down Find.
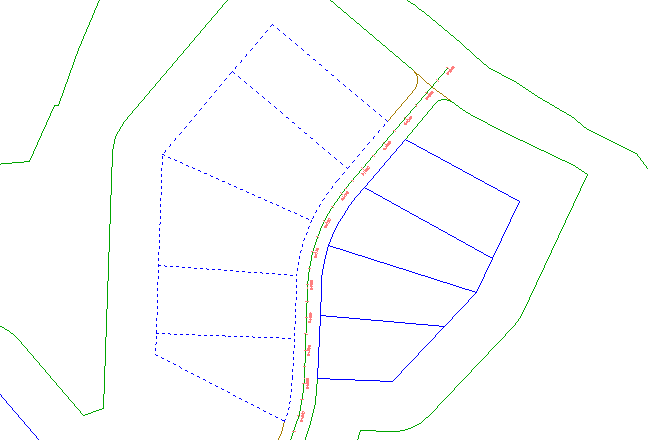
 - Select the lines and the polyline border at the east side of the site, north of the First Street alignment. Press Enter.
 Note:
Note:On the command line, notice that a variety of AutoCAD objects can be used to create plots.
- In the Create Plots – From Objects dialog box, specify the following parameters:
- Site: Site 1
- Plot Style: Single-Family
- Area Label Style: Plot Number And Area Note:
Plots must have area labels, but segment labels are optional.
- Automatically Add Segment Labels: Selected
- Erase Existing Elements: Selected
- Click OK.
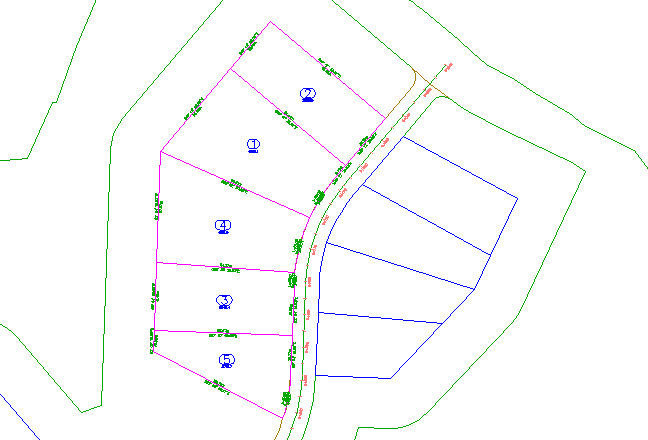
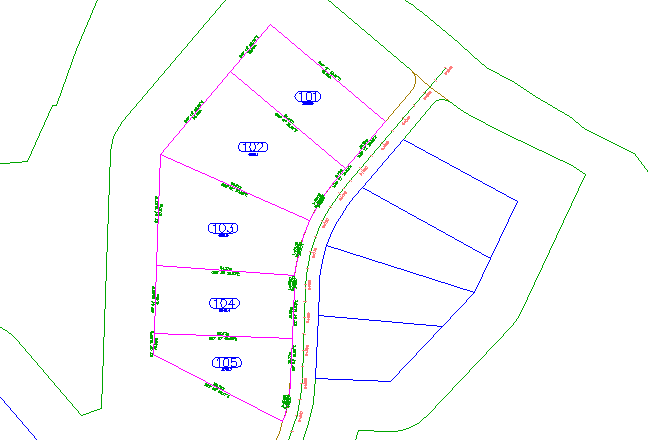
The plots are created and labeled. The labels annotate the overall plot area, as well as the quadrant bearing and distance of each line and curve segment. These labels are automatically updated if any line or curve segments are edited or deleted.
The numbers with a circular border are automatically generated plot numbers. You will change these numbers to use a more desirable numbering convention.
Change the plot numbering
- Click a plot number to select it. Click tab panel Find.
- In the Renumber/Rename Plots dialog box, specify the following parameters:
- Renumber: Selected
- Starting Number: 101
- Increment Value: 1
- Click OK.
- To specify a start point, click to top-most plot.
- To specify an end point, click the bottom-most plot.
- Press Enter twice.
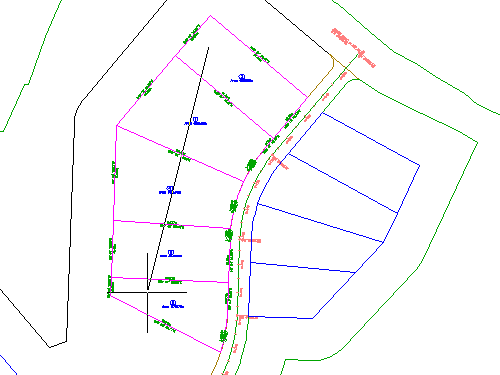
The plot area labels are now numbered in ascending order, with three digits.
To continue this tutorial, go to Exercise 2: Subdividing a Plot with a Free-Form Segment.