In this exercise, you will add data boxes along the bottom of a profile view.
Add profile view data boxes
- Open Profile-6A.dwg, which is located in the tutorials drawings folder.
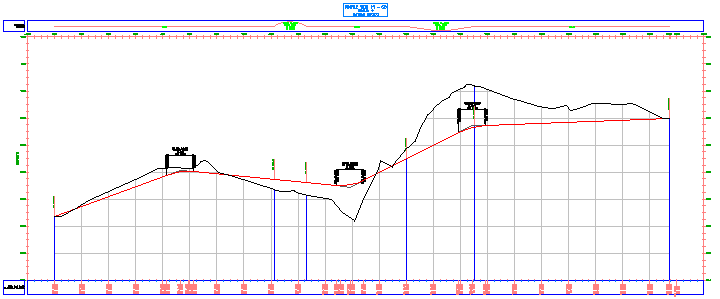
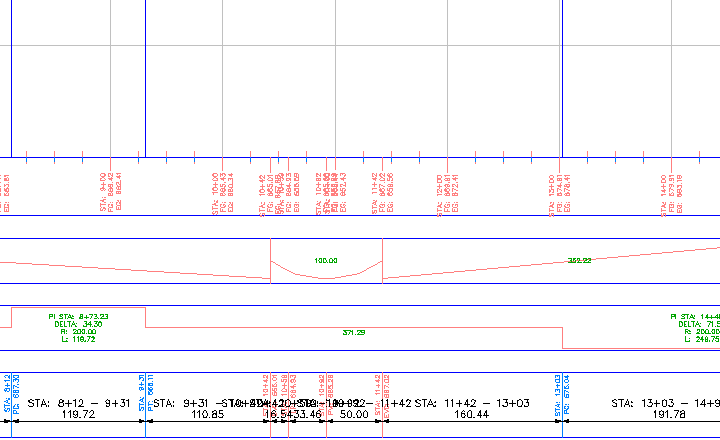
The data box at the top of profile view PV - (3) shows the locations of horizontal curves in the parent alignment. Blue vertical lines cross the profile view grid to mark the start and end of each horizontal curve. The data box at the bottom annotates the level of both profiles at the major chainages.
- Select the profile grid. Right-click. Click .
- In the Profile View Properties dialog box, on the Bands tab, specify the following parameters:
- Band Type: Vertical Geometry
- Select Band Style: Geometry
- Location: Bottom Of Profile View
- Click Add.
The band is added to the bottom of the list.
- Click Apply.
The new data box is displayed at the bottom of the stack of data boxes. This data box labels the vertical geometry points of the first profile in the list. In this case, the existing ground profile was selected by default. You will change the referenced profile later in this exercise.
- In the Profile View Properties dialog box, on the Bands tab, specify the following parameters:
- Band Type: Horizontal Geometry
- Select Band Style: Curvature
- Location: Bottom Of Profile View
- Click Add.
- Click Apply.
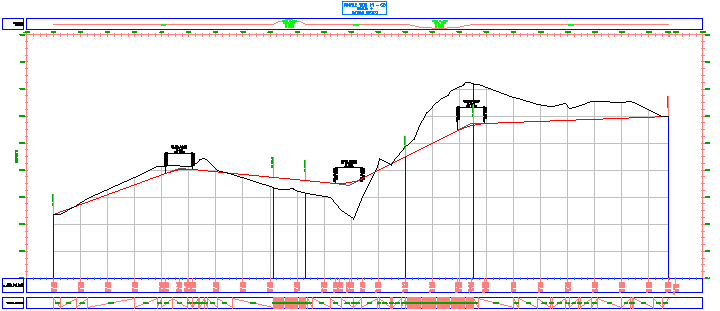
The horizontal geometry band is added to the bottom of the profile view in the drawing. This data box is drawn in a different style from the one along the top of the grid. However, both styles show the location of horizontal curves and are labeled with basic engineering data about the curves. These bands are useful for evaluating the design profile from a drainage and safety point-of-view.

- In the Profile View Properties dialog box, on the Bands tab, specify the following parameters:
- Band Type: Profile Data
- Select Band Style: Horizontal and Vertical Geometry Point Distance
- Location: Bottom Of Profile View
- Click Add.
In the Geometry Points To Label In Band dialog box, you can specify the individual horizontal and vertical geometry points to label using the current style. For this exercise, you will accept the default selections.
- In the Geometry Points To Label In Band dialog box, click OK. Note:
For more information on geometry point labeling, see the Adding Labels in Groups tutorial exercise.
- Click Apply.
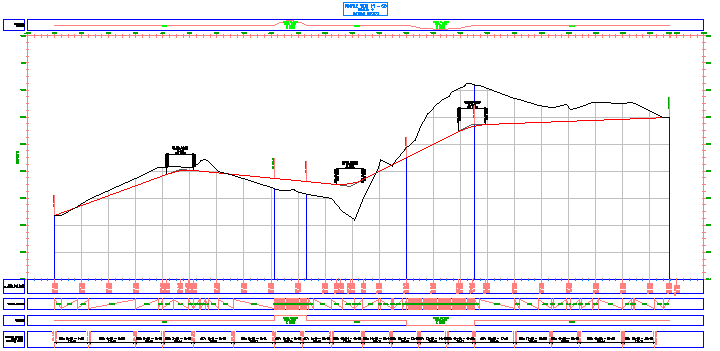
The new data box is displayed at the bottom of the stack of data boxes. This data box labels the incremental distance between the horizontal geometry points of the parent alignment.
Change the profiles referenced in data boxes
- In the List Of Bands table, in the Profile1 column, change the value to Layout (1) for the Profile Data box at the bottom of the list.
- Click Apply.
Now, the Profile Data box shows levels of both the existing ground and finished design profile at each major chainage. The Horizontal Geometry Point Distance band displays the finished ground level at each horizontal geometry point.
- For the Vertical Geometry band, change the Profile1 setting to Layout - (1).
- Click Apply.
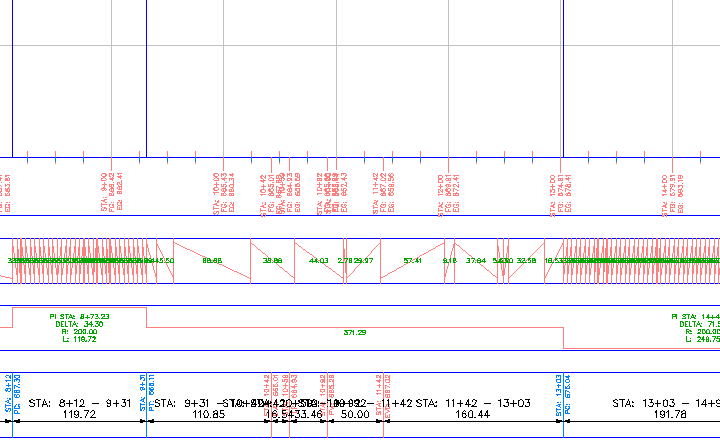
Now, this band shows the length of each gradient segment along the layout profile.
Rearrange the data boxes
- In the table of bands list, select the Vertical Geometry band. Click
 twice, then click Apply.
 The Vertical Geometry band moves to the bottom of the stack of data boxes.
- Click OK.
This arrangement of bands is convenient for analysis. It displays horizontal and vertical geometry, as well as comparative level data for the surface profile and the layout profile.
Notice that in the bottom, Vertical Geometry band, the labels in the uphill straights are obscured by the straights. You will correct this in Exercise 3: Modifying a Data Box Style.
To continue this tutorial, go to Exercise 2: Moving Labels in a Data Box.