In this exercise, you will subdivide a plot with a segment that swings from a reference point on the back line.
This exercise continues from Exercise 3: Subdividing a Plot with a Slide Line.
Specify plot creation settings
- Open Parcel-1D.dwg, which is available in the tutorials drawings folder.
- Click tab
 panel drop-down Find.
 - On the Plot Layout Tools toolbar, click
 .
. - Specify the following parameters:
As you specify each parameter, notice that a preview graphic is displayed at the bottom of the Plot Layout Tools window.
Plot Sizing
Automatic Layout
- Minimum Area: 8000.00
- Minimum Frontage: 40.0000
- Use Minimum Frontage At Offset: Yes
- Frontage Offset: 20.0000
- Minimum Width: 40.0000
- Minimum Depth: 50.0000
- Use Maximum Depth: Yes
- Maximum Depth: 200.0000
- Multiple Solution Preference: Use Smallest Area
- Automatic Mode: Off
- Remainder Distribution: Place Remainder In Last Plot
Create plots using a swing line
- On the Plot Layout Tools toolbar, click
 Swing Line – Create.
 - In the Create Plots – Layout dialog box, for Plot Style, select Single-Family. Leave other settings at their default values. Click OK.
- In the drawing, select the area label of the large plot in the northeast corner of the site.
- Specify the start and end points of the plot frontage as shown in the following image.
Notice that when you move the cursor to specify the end point, a yellow line displays the proposed frontage.
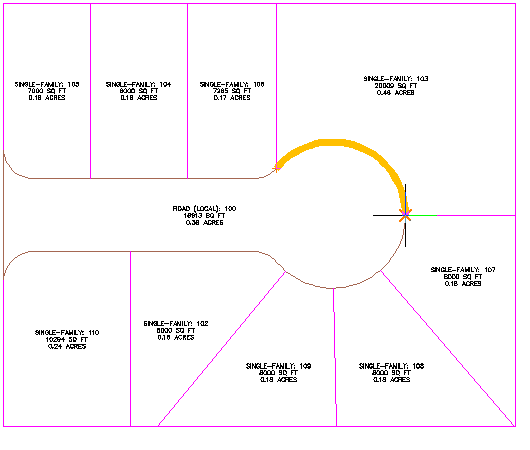
- Click the northeast corner of the plot to specify the swing point.
A preview graphic is displayed.
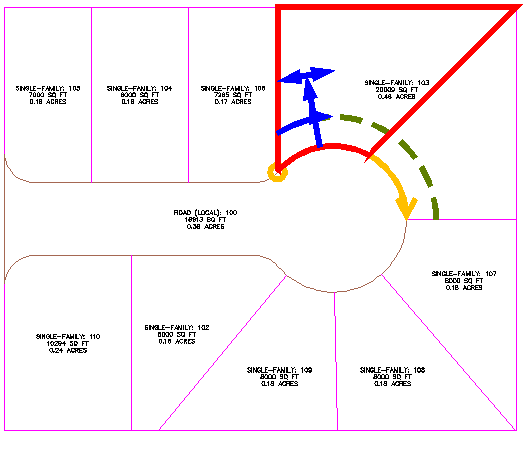
- Press Enter to create the plot.
The new plot is created and labeled.
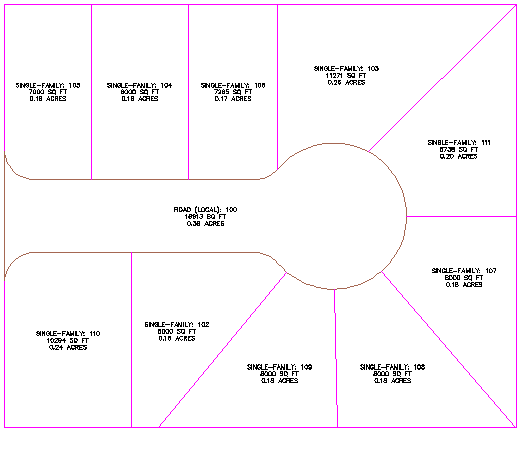
- Press Esc to end the command.
To continue this tutorial, go to Exercise 5: Working with Alignments and Plots.