In this exercise, you will successively subdivide a plot with segments that are defined by their angle at the frontage.
This exercise continues from Exercise 2: Subdividing a Plot with a Free-Form Segment.
Specify plot creation settings
- Open Parcel-1C.dwg, which is available in the tutorials drawings folder.
- Click tab
 panel drop-down Find.
 - On the Plot Layout Tools toolbar, click
 .
. - Specify the following parameters:
As you specify each parameter, notice that a preview graphic is displayed at the bottom of the Plot Layout Tools window.
Plot Sizing
Automatic Layout
- Minimum Area: 7000.00
- Minimum Frontage: 40.0000
- Use Minimum Frontage At Offset: Yes
- Frontage Offset: 20.0000
- Minimum Width: 40.0000
- Minimum Depth: 50.0000
- Use Maximum Depth: Yes
- Maximum Depth: 200.0000
- Multiple Solution Preference: Use Smallest Area
- Automatic Mode: Off
- Remainder Distribution: Place Remainder In Last Plot Note:
When Automatic Mode is set to Off, the Remainder Distribution setting does not affect plot layout. This setting will be used in later exercises.
Create individual plots using a slide line
- In the Plot Layout Tools toolbar, click
 Slide Line – Create.
 - In the Create Plots – Layout dialog box, for Plot Style, select Single-Family. Leave other settings at their default values. Click OK.
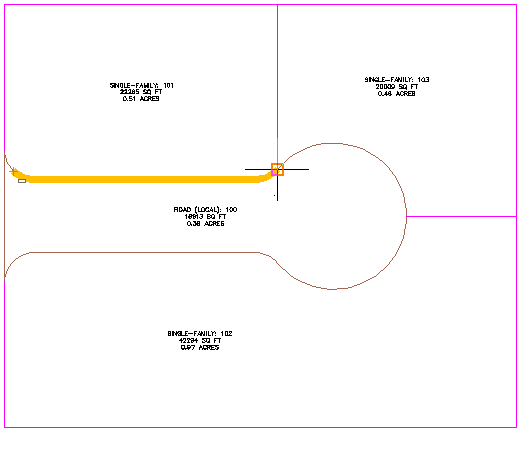
- Click the area label for plot Single-Family: 101.
- Specify the start and end points of the plot frontage as shown in the following image.
Notice that when you move the cursor to specify the end point, a yellow line displays the proposed frontage.
Note:When you specify the frontage starting point, do not snap to the beginning of the curve. If the frontage starts at the beginning point of the curve, no solution will be found.
- Enter a frontage angle of 90 degrees.
Preview graphics of the plot creation parameters and proposed solution are displayed. The graphics are similar to those that were displayed while you were specifying plot creation parameters in the Plot Layout Tools window.
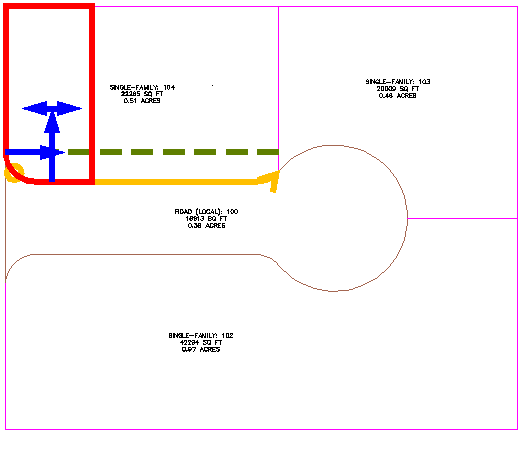
- Press Enter.
The new plot is created and labeled, and a preview of the next plot is displayed in the drawing.
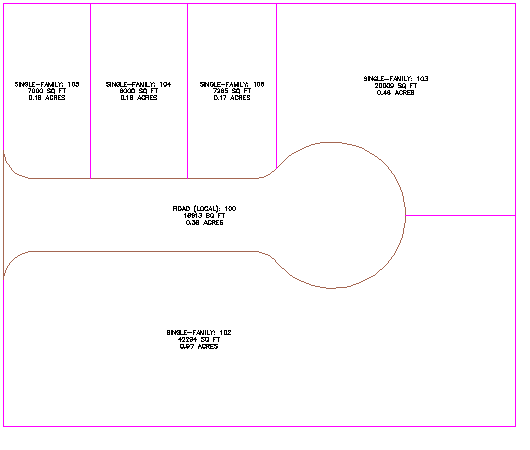
- In the Plot Layout Tools dialog box, for Minimum Area, enter 8000.
Notice that the preview graphic updates to reflect the changed area value.
- Press Enter.
Two new plots are created and labeled.
Create multiple plots simultaneously
- In the Plot Layout Tools toolbar, click
 Slide Line – Create.
 - Under Automatic Layout, specify the following parameters:
- Automatic Mode: On
- Remainder Distribution: Place Remainder In Last Plot
- Click the area label for the large plot on the south side of the site.
- Specify the start and end points of the plot frontage as shown in the following image.
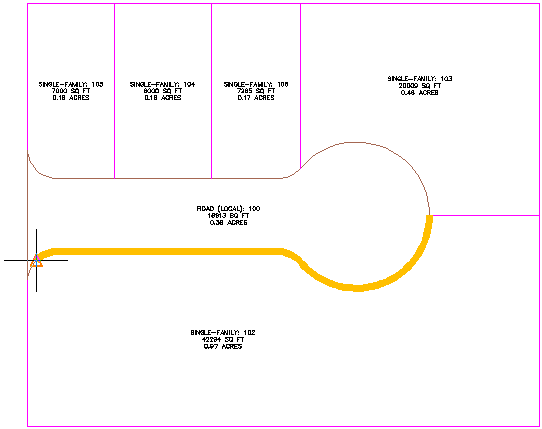
- Enter a frontage angle of 90 degrees.
A preview of the proposed plots is displayed.
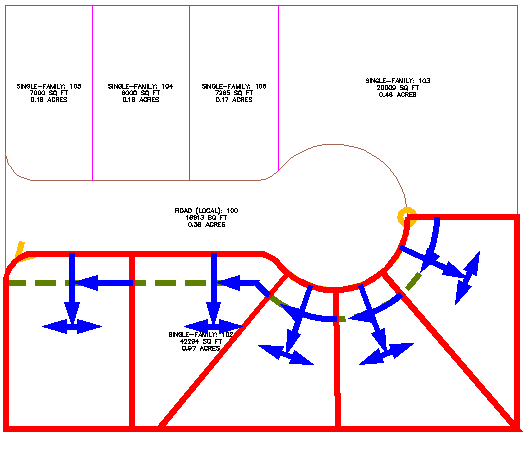
- Press Enter.
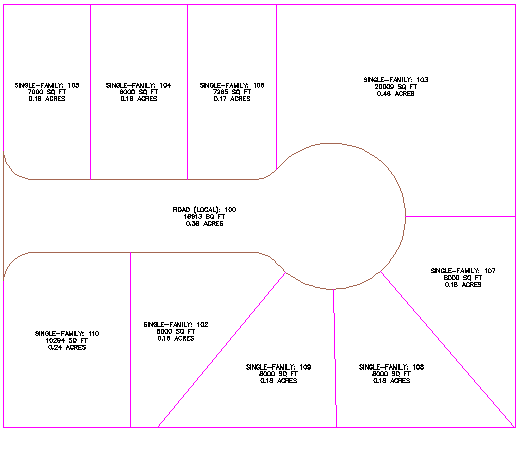
The new plots are created and labeled.
Note:You will correct the placement of some of the plot lines in the Editing Plot Data tutorial.
- Press Esc to end the command.
To continue this tutorial, go to Exercise 4: Subdividing a Plot with a Swing Line.