In this step, you review the Fill Time, the Pressure at V/P switchover, and the Temperature at flow front results.
Open the model from your previous analysis.
Fill Time result
-
Click Fill time from the Results in the Study Tasks list.
-
Rotate, Pan, and Zoom the model as necessary to inspect the Fill time result.
-
Click
 () to animate the result. Use the other animation tools to understand their function.
-
Rotate the part similar to the plot.
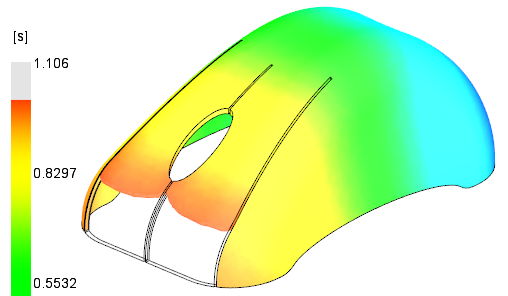
The image shows that the outer corners have filled before the inner two tabs.
-
Click
 () to show the value at a specific location on the part. Use the
CTRL key when clicking the part to select more than one location.
() to show the value at a specific location on the part. Use the
CTRL key when clicking the part to select more than one location.
Pressure at V/P Switchover result
-
Click Pressure at V/P switchover in the Study Tasks list.
-
Rotate, Pan, and Zoom the model as necessary to inspect the fill time result.
-
Click
() to animate the result.
-
Rotate the part similar to the plot.
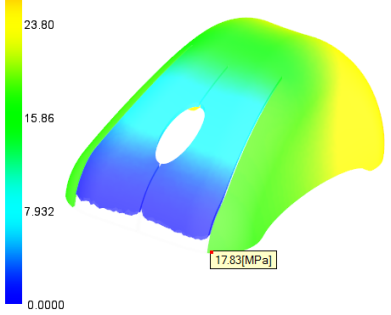
There is a significant pressure difference at V/P switchover between the areas of concern.
Temperature at Flow Front result
-
Click Temperature at flow front in the Study Tasks list.
-
Rotate, Pan, and Zoom the model as necessary to inspect the fill time result.
-
Rotate the part similar to the plot.
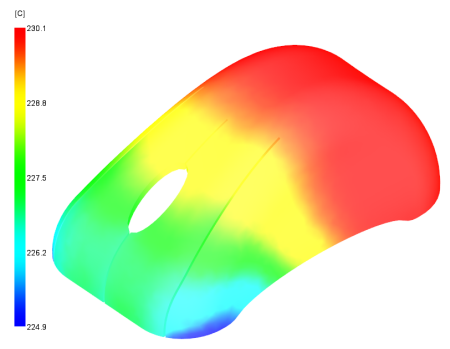
The outer corners are cooler than the inner tabs.
All three results have issues that should be investigated further.