Use the Point dialog to plot the time- or iteration-history at a specific location in the model with Result Points. Designate Result Points as Summary Points to assess Critical Values and to compare results from multiple scenarios in the Decision Center.
An example using a Result Point to assess time-history is in a pressure relief valve. The time-dependent pressure build-up and subsequent venting of a valve was simulated with a transient Design Study. To know if the design objective was attained, the time history of pressure at a critical location in the valve must be plotted.
Before the Scenario was started, a Results Save Interval was specified on the Solve dialog. This causes Autodesk® CFD to save intermediate time steps throughout the calculation.
To plot the time history of pressure at the critical location, create a Result Point, and click View Plot. The result is an XY plot of the results for every saved time step.
Creating Result Points
To create and plot data on a Result Point:
- Click Results (tab) > Results Tasks (panel) > Points. If the Points dialog does not appear, click View (tab) > Appearance (panel) > Selection List.
- There are several ways to define the location of a Results Point:
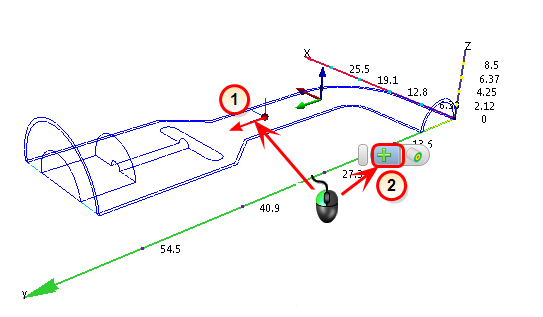
- Method 1: Create the point at the origin of the triad:
1. Drag the triad so that the origin is at the desired location.
2. Left click off the triad, and click the Add icon on the Context toolbar.

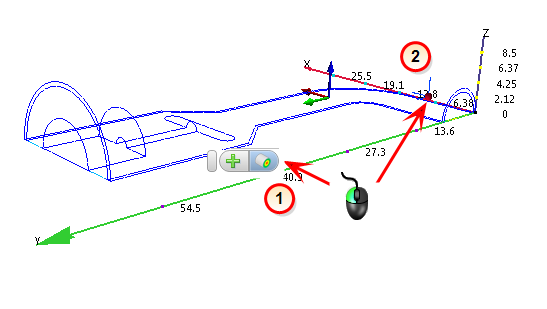
- Method 2: Create the point on a geometric surface, iso surface, or result plane.
1. Left click off the model, and click the Align to Surface icon.
2. Click on the desired location of a surface.

Note that the selection tool gives higher priority to shaded surfaces. To position a monitor point on an outlined surface, be careful not to click too close to a shaded surface.
- Method 3: Use the X, Y, and Z sliders on the Points dialog to position the point on the model.
- Method 4: Key in specific coordinates on the Points dialog.
- Method 1: Create the point at the origin of the triad:
- Assign a name to the Point in the Name field.
- To create the point, click the Add icon either on the Points dialog or on the Context panel.
- Plot the results by clicking the View Plot button.
Comparing Results using Summary Points
To compare results from multiple scenarios or to compare against critical values, designate the Results Point as a Summary Point by checking the box in the Summary column adjacent to the desired Point.
- The Point is listed as a Summary Part in the Decision Center.
- Results at the point location from each scenario are listed in the Critical Values table of the Output Bar.
Related Topics