Particle Traces are conceptually similar to an injected dye stream in the flow. They are a very powerful way to visualize flow movement.
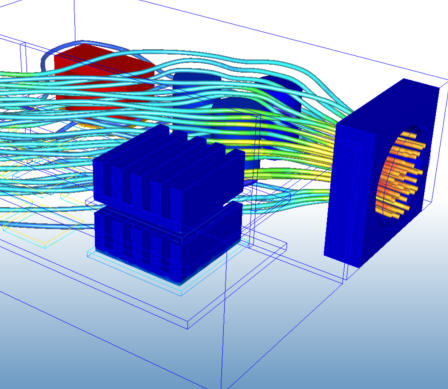
To Create Particle Traces
- Click Results (tab) > Results Tasks (panel) > Traces.
- Define the Seed Type, Pattern, and Density from the Create Set panel. (You can use the default settings or modify the settings from the menus.)
- Click Add.
- Click on a surface of the model. Depending on the Seed Type, you may have to click and drag, click multiple times, or simply click on specific locations to define the seed distribution.
- To move a seed set, left click on an axis in the triad and drag to the desired location anywhere in the model. Rotate the trace set by dragging the arc on the triad.
When you click on a surface, the seed point is created on the first shaded geometric surface or results plane in line with the mouse cursor. If there are no shaded surfaces in line with the mouse, the seed point is created on the first visible surface (which can be displayed as outline). If the surface is an flow opening (or an internal surface between two flow regions), traces grow from the seeds. If the surface is an external solid surface, trace are not drawn from the seeds. However, you can move the seed into the flow field by dragging an axis on the triad.
To hide a trace set, right click on the set, and select Hide Trace Set. You can also uncheck the Traces Set branch in the Results branch of the Design Study Bar.
To resume a hidden trace set, either drag the axis triad slightly or check the Traces Set branch in the Results branch of the Design Study Bar.
Seed Type
Use the Seed Type menu options to control how seeds are arranged. Some of these options are useful for creating large numbers of seeds; others are ideal for creating a few seeds in specific locations.
Point
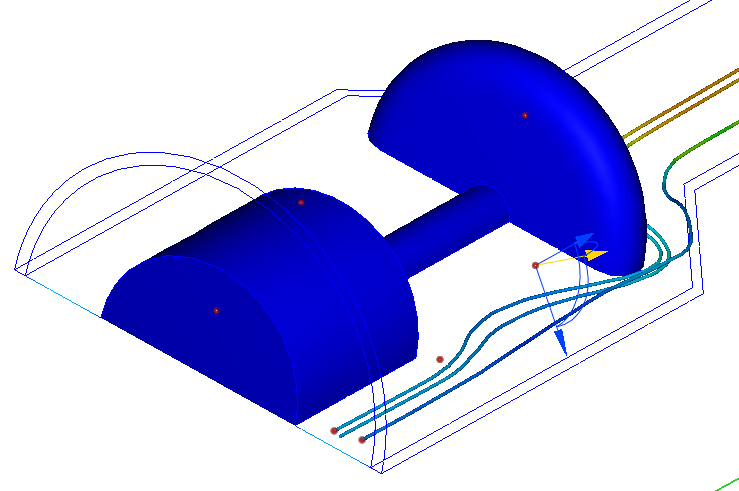
Use Point to create individual trace seeds on model surfaces.
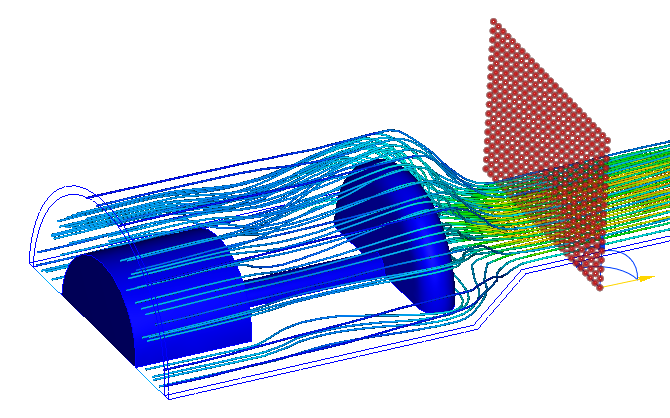
In the image, note that the seeds positioned at the outlet have traces. The seeds positioned on the outer wall and on the shaded poppet do not have traces because they are on solid surfaces where the flow is not moving.
Line
Use Line to create a single row of trace seeds. Click once at one end of the line, drag to the desired length, and click again to complete the line:
Ring
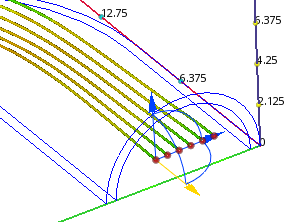
Use Ring to create an unfilled circular shape of trace seeds. Click once at the center of the circle, drag to the desired radius, and click to complete the ring form:
Circular
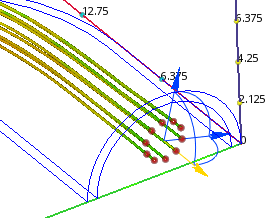
Use Circular to create a filled circular shape of trace seeds. Click once at the center of the circle, drag to the desired radius, and click to complete the circular form:
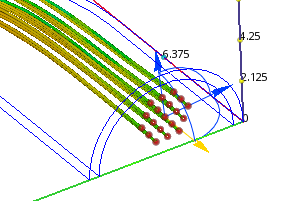
Rectangular
Use Rectangular to create an ordered grid. Click once to define the first corner, drag to the desired width and click again. Drag to the desired height, and click a third time to complete the rectangular form:
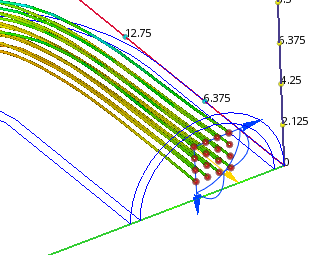
Region
The Region option applies the trace seed distribution directly to the geometry plane or to the results plane. Use this to create a uniform distribution of traces throughout the entire results plane. This method is useful when computing Erosion.
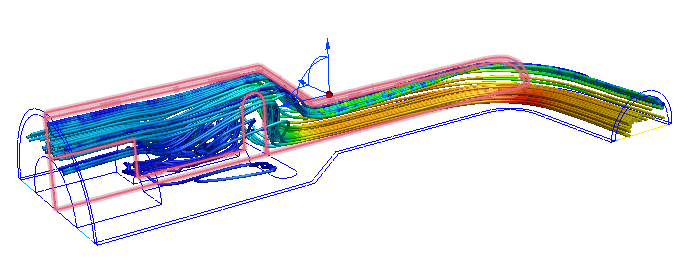
Key-in
Key in the exact X, Y, and Z coordinates. Separate each coordinate with a comma. (Do not surround the coordinates with brackets or parentheses.)
Seed Pattern
You can use the Seed Pattern to control how seed points are spaced on the definition grid. Note that the Seed Pattern cannot be selected for certain Seed Types (such as Line or Point).
Diamond
The Diamond pattern staggers the seed points through the plane:
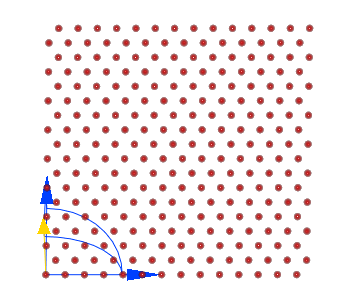
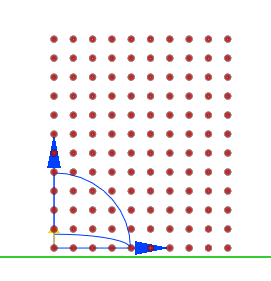
Grid
The Grid pattern creates an ordered distribution:
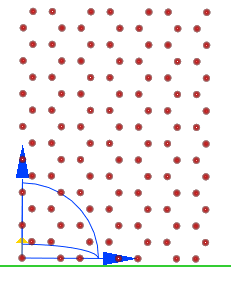
Hexagon
The Hexagon pattern staggers the seed points into a hexagonal distribution:
To Edit Particle Traces
Click Edit from the Modify Set panel to open the Edit Trace Set dialog. You can use this to delete individual traces, change the displayed result quantity or show traces as a solid color, and modify the properties of traces.
- By default, traces are ordered in the table by their Trace ID.
- To sort traces by either ID or Residence time, click the appropriate column header.
- To delete an individual trace, select it from the list, and click Delete. Click Delete set to remove all of the traces in the set.
- To remove an entire trace set, click Remove from the Modify Set panel. To remove all traces, expand the Remove button, and click Remove All.
Results / Color
Change the displayed result quantity by selecting from the Results menu. To show traces with a uniform color, select Solid, and click the color selector to change the color.
Note that you can control the result / color from the Edit Trace Set dialog, by right clicking on the trace set on the model, or by right clicking from the Traces Set branch in the Results branch of the Design Study Bar.
To Modify Trace Properties
Appearance
You can control the appearance of the trace set from the Edit Trace Set dialog, by right clicking on the trace set on the model, or by right clicking from the Traces Set branch in the Results branch of the Design Study Bar.
Cylinders

Lines
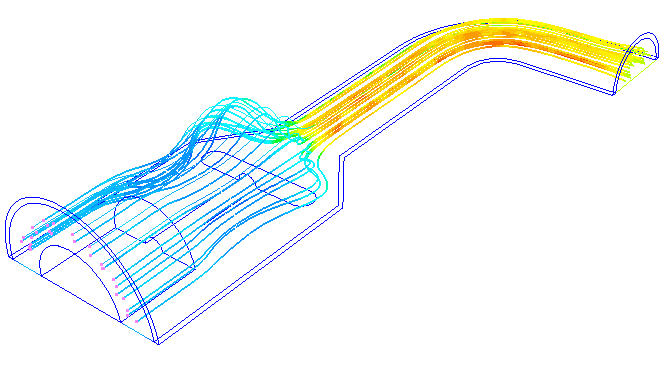
Comets
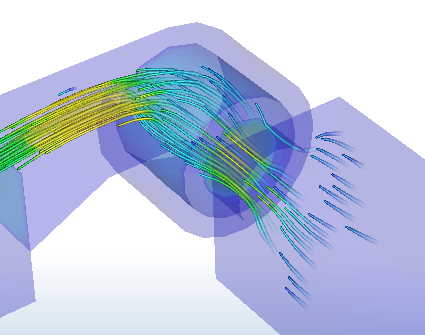
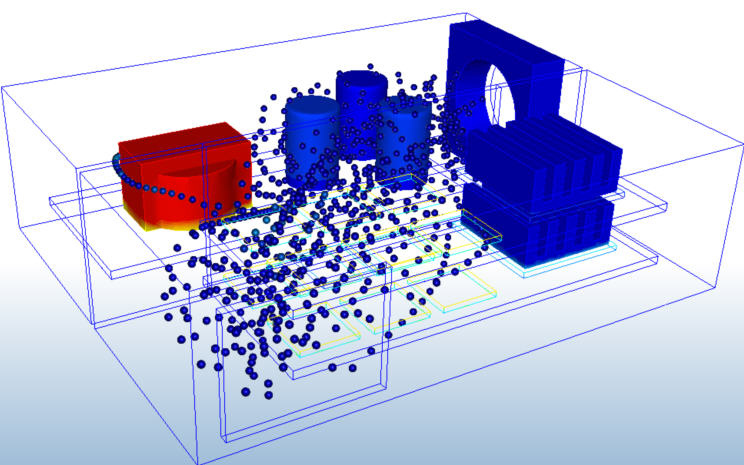
Spheres
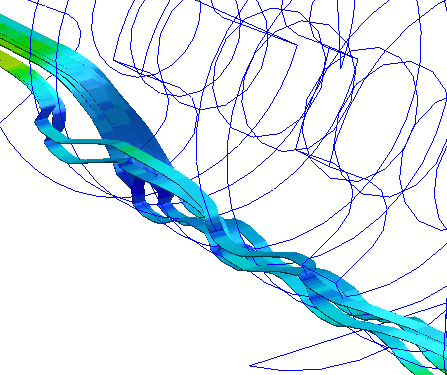
Ribbons
Range
Use Range to define if complete traces (Full Range) are drawn, or if only the length upstream (Backward) or downstream (Forward) of the seed points is drawn.
Note that you can control the range from the Edit Trace Set dialog, by right clicking on the trace set on the model, or by right clicking from the Traces Set branch in the Results branch of the Design Study Bar.
Trace Width
Control the size of the trace with the Width setting. Increasing the width for cylinders, spheres, and points, makes the diameter bigger. Increasing the width for lines makes them appear as ribbons.
Steps
Control the length of the trace with the Max Steps setting. The default of 5000 is adequate for most traces. Increase this value for very finely meshed models if traces stop mid-way through the model.
Mass
By default, particle traces do not have mass, so their movement is only influenced by the flow. To cause traces to behave more like a physical substance within a flow system, enable Mass.
Projecting Trace Seeds
The commands in the Project Seeds panel allow traces to be positioned onto specific surfaces or on a seed plane. These commands are useful for positioning traces at specific locations on or just off of the model for visualizing flow very close to solid objects.
Down to Shaded Surface
This is useful for concentrating traces just off a solid, and is ideal for aerodynamics studies or human comfort simulations in which the flow very close to the solid form is of particular interest. To project seeds to a particular surface:
- Create a trace set near the object of interest. It is a good idea to use a seed distribution that exceeds the size of the object. Note that you may have to create the seed grid well off of the solid and then move it (using the axis triad) into position near the object.
- Because this command works by projecting the seed traces in the negative direction of the yellow axis, ensure that the orientation is correct by rotating the axis triad if necessary.
- Change the appearance of the object to shaded. (You can do this from the Parts branch of the Design Study Bar by right clicking on the part and selecting Shaded. Make sure that Traces is selected from the Results Task panel after shading the part.)
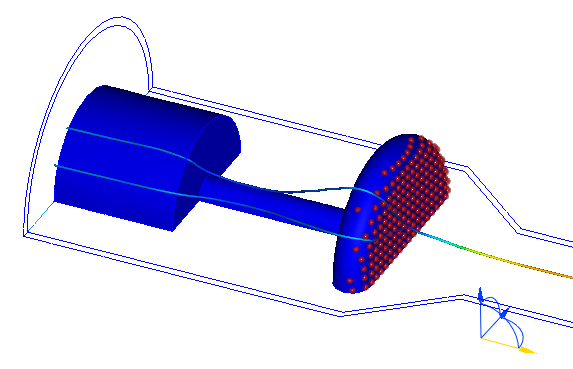
- Click Down to Shaded Surface from the Project Seeds panel. The seed points are then projected to the first shaded surface in line with the negative yellow axis of the triad.
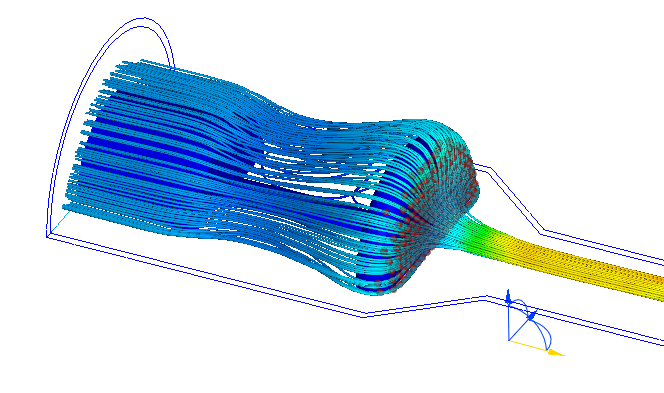
- To see the flow very close to the surface, drag the triad a small distance away from the solid part:
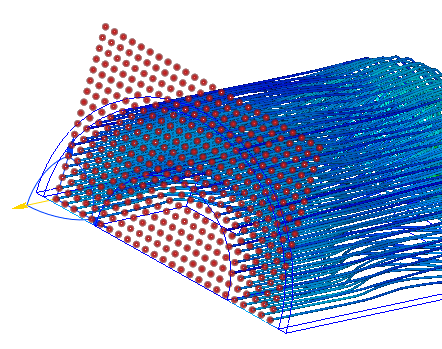
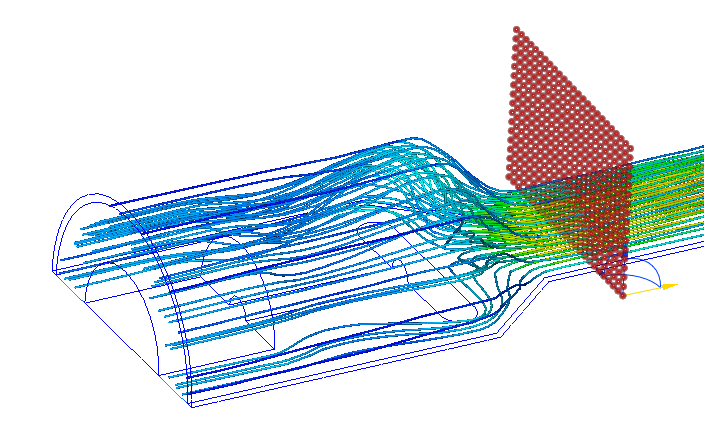
If no traces can be projected onto a surface, the trace distribution remains unchanged.
Up to Seed Plane
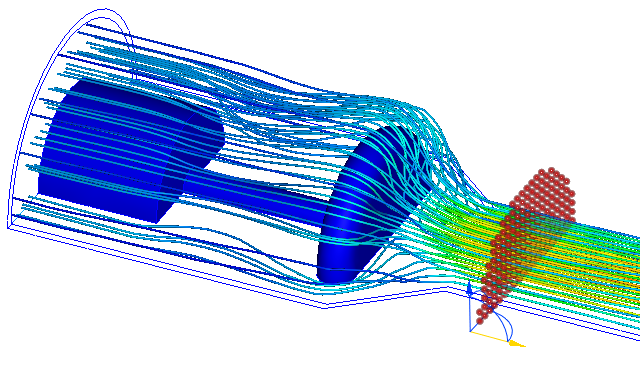
To project trace seeds that are distributed across a curved surface onto a plane, click Up to Seed Plane. This moves the seed points to the plane defined by the two blue axes in the triad.

Process Traces
After you have created traces, you can use the Process commands to animate them and to extract data to external files.
Animation
Click Animate from the Process Traces panel to open the Animate Traces dialog.
- Begin the animation by clicking the Play button. While animating, this button changes to a Pause button.
- To "grow" traces either forward or backward, click one of the incremental Step buttons.
- To display the traces at their longest, click the Fast Forward button.
- To display the traces at their shortest, click the Rewind button.
Vary the animation speed with the Animation Time setting.
Save the animation by clicking Save avi…
Save Data Table
The time that a trace takes to traverse through the model is its residence time, and is listed for each trace. To output the residence time for all traces, click Save Data Table. You will be prompted to select a folder and input a file name. The data is saved to a csv file that you can inspect in Microsoft® Excel.
Save Bounce Data Table
This is used for massed particle traces, and lists the bounces experienced by each trace.
This table provides information about massed particle traces as they collide with solids and walls. This information is very useful for understanding the interaction between the flow and a moving solid object as long as the motion of the solid does not influence the flow.
When you click this button, Autodesk® CFD generates a report (".csv" file) that lists the collisions for each massed particle trace:
- Time of the collision
- Number of collisions and collision location (x, y, z coordinates)
- A vector representing the impact force of the collision
- Velocity vectors before and after the collision
Related Links