Data View serves as the command center for the Advanced Data Manipulation tools in Particle Flow. The basic operation of Data View is similar to that of Particle View: You start to build a data flow by dragging suboperators from the Depot at the bottom of the dialog into the main window. You access a suboperator's parameters by clicking it so its rollout appears on the right side of the dialog. And you create the actual flow, or schematic, by connecting suboperators, dragging between the output connector of one and an input connector or filter connector of another.
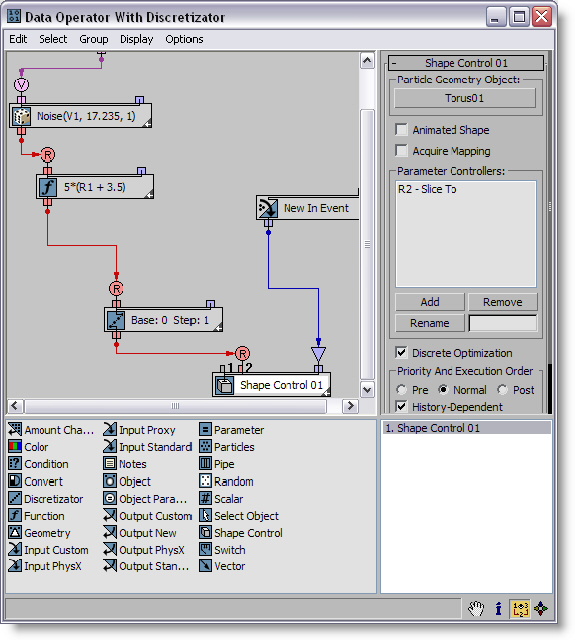
However, not all suboperators need to be physically connected; they can also be logically connected via Channel buttons, such as Particles suboperator  Weight Data Channel. In these cases you click the button and then choose the channel from the list in the Select Data Channel dialog that opens.
Wiring Suboperators
When connecting suboperators, it's important to keep the data types consistent. That is, the data type output by the "from" suboperator should be the same as the type input by the "to" suboperator. If the two data types are not the same but are potentially compatible, Data View automatically places a conversion suboperator between them when you connect them. For example, if you connect a suboperator that outputs vector data to one that inputs real data, Data View places a Convert suboperator between them, and sets it to Vector -> Real. Similarly, connecting a suboperator that outputs a data type other than Boolean to another suboperator's Filter input automatically inserts a Condition suboperator set to the correct input type between the two.
 Vector, and you change the Speed setting to Magnitude, Particle Flow removes the wire. Even if you then change the data type back to the previous setting, the wiring is not automatically restored; you must rewire the suboperators manually. Alternatively, using Undo restores the wiring.
 Dynamic Suboperator Names
It's important to note that Particle Flow gives each suboperator a dynamic default name based on its most significant setting. For example, if you add a Particles suboperator, it's given the name Closest Particle Index because that's the default Aggregated Property setting. If you change the Aggregated Property setting, say to Density, the dynamic name changes to Density. You can turn off the Dynamic Name feature for each suboperator from its right-click menu (and globally using the Use Dynamic Names For New function on the Options menu). If you rename a suboperator, this automatically turns off Dynamic Name.
Suboperator Controls
The suboperator as visually represented in Data View is basically similar to an operator or test in Particle View. For example, you can Shift+drag a suboperator to create a copy or instance. You can click its icon to toggle its active status, drag its right edge to change its width, and right-click it to open a context menu of relevant commands.
However, there are several noteworthy functional differences. First, the suboperator has two types of inputs: data, of which there can be one or more, and filter, of which there is always one.
Data Inputs
The data inputs appear on the top of the suboperator, starting at the left side. Each input is numbered to correspond to the corresponding parameter in its rollout, and has two indications as to its data type: a letter and a color. For example, an input for vector data is violet, and for quaternion data is yellow. For a full list of the data types and their respective color codes, see Data Types.
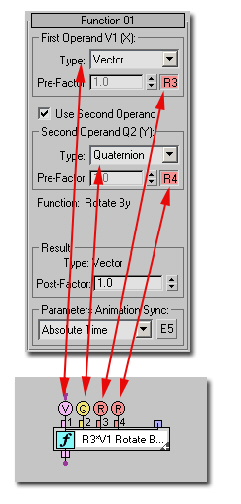
Suboperator with input connectors (below) and related parameters (above)
Filter Input
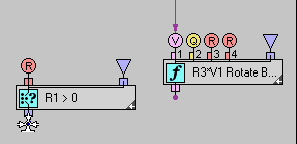
Near the top-right corner of each suboperator is the filter input connector; this lets you specify a subset of particles to process. The filter input accepts Boolean data only, as indicated by its blue color. Usage of this input is strictly optional; if you want the suboperator to process all particles in the event, you needn't use it. If you want the suboperator to process only certain particles, set up the condition and then wire it to the filter input. For example, you could limit processing to particles within a certain distance of the current particle, using a Particles suboperator wired to a Condition suboperator; you'd then wire the output of the Condition suboperator to the suboperator that is to perform the processing.
Note: When you position the mouse cursor over a suboperator's Boolean output connector, a funnel icon (an inverted triangle) appears temporarily over each filter input connector, as shown in the following illustration, to indicate that it can be wired to the Boolean output.
Suboperator Blocks
Data diagrams in Data View can quickly become very complex. To simplify the visual flow, you can combine suboperators physically into solid blocks. To do this, simply drag a suboperator on top of another to which it is wired. When yellow outlines appear around both suboperators, release the mouse to combine them into a block. You can remove a suboperator from a block simply by dragging it away from the block; release the mouse when the yellow outlining disappears.
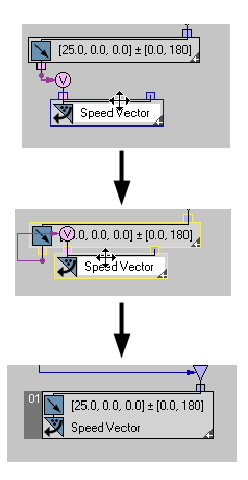
Top: Start dragging a suboperator toward a connected one.
Center: When the yellow outlines appear, release the mouse button to combine them into a block.
Bottom: The block has a tab on the left side that you can use to manipulate it.
Grouping Suboperators
A different way of combining suboperators that has no logical restrictions is with groups. Grouping in Data View is similar to grouping objects in 3ds Max. To create a group, select some suboperators and then choose the Group command from the Data View Group menu or right-click menu.
Some additional points about groups:
- You can add a new suboperator directly to a group by dragging it into the group window from the Depot.
- If you drag a suboperator in a group toward the edge of the group window, the window expands to contain the suboperator.
- To place a group window in front of another group window, drag the former over the latter.
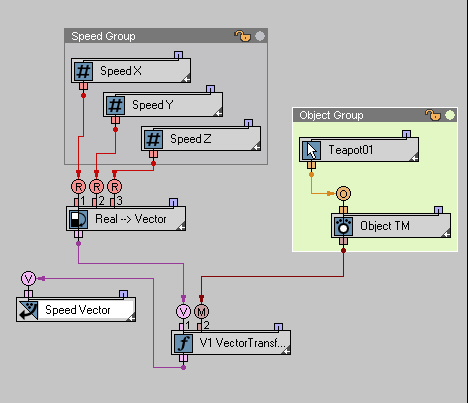
Groups in Data View
The controls, available on the Group menu, are:
- Group
- Combines all highlighted, ungrouped suboperators into a named group. Available only when more than one ungrouped suboperators are highlighted.
A group takes the visible form of a window containing the grouped suboperators, which you can reposition and resize like any standard window in Windows. The window title bar contains the group name and two icons: a lock icon and a small, circular color swatch. When locked, the suboperators cannot be moved within the group window, nor can they be resized. However, they can still be highlighted and their parameters edited. Use the color swatch to change the window background color.
- Ungroup
- Restores all suboperators in the highlighted group to their original, ungrouped condition. Available only when a group is highlighted.
- Open/Close
- Unlocks and locks the group; this is the same as clicking the lock icon in the group title bar. When a group is locked, you can move its window and change the member suboperators' parameters, but you can't resize the window or move the suboperators within the window.
- Tighten
- When on, the group window shrinks to fit a bounding rectangle around the member suboperators. When off, to resize a group window, drag an edge or a corner. If Tighten is on for a group and you enlarge the window manually, the software turns off Tighten for the group.
- Transparent
- When on, objects such as groups and suboperators are visible behind the frontmost group window.
- Attach
- Adds the highlighted suboperator to the highlighted group. This command is available if the current selection set comprises a single open group and one or more suboperators, and for a suboperator if it overlaps an open group window.
- Detach
- Removes the highlighted suboperator from its group. The suboperator remains in place, but it's no longer part of the group.
The Group, Attach, and Detach commands are also available from the right-click menu in Data View for suboperators. Also, if you right-click a group in Data View, the menu provides the group commands Flip (flips the group window vertically, so the title bar is on the bottom), Tighten, Transparent, Open, and Close.
Additional Controls
Each suboperator and block has a small arrow at its bottom-right corner. Clicking this arrow toggles the maximized/minimized state of the item. If it's maximized, the arrow points left; if it's minimized, the arrow points right. As with combining suboperators into blocks, minimizing helps reduce clutter in the Data View interface.

Left: Maximized group; Right: Minimized group
Also, in the bottom-right corner of the Data View dialog are found, in addition to the Pan tool present on the Particle View dialog, buttons for controlling the display.
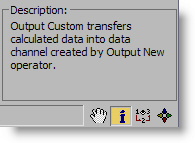
The first button, Description, whose icon is a lower-case "i", simply toggles the Description box that displays information about the highlighted suboperator in the Depot.
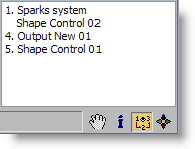
The second button, Output Order, shows the output order of suboperators that have Execution Order and Priority Order settings. If two or more suboperators have the same Execution Order value, they're listed under the same number, in the order of Priority Order values.
You can highlight the corresponding output suboperator in Data View for an item in the list by clicking the list member, and vice-versa (click the suboperator to highlight its list member).
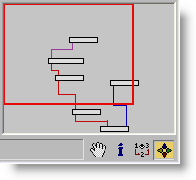
The third button, Navigation, shows a mini-map of the Data View window. You can pan around the window by dragging inside the red outline, which shows the current extents of the window. Clicking outside the red outline jumps to that part of the window.
The Navigation map always shows the full data layout, so it zooms dynamically as you drag in the red outline. However, it does not affect the magnification of the main Data View window.
Menus
The Data View menus contain a number of standard, self-explanatory commands. This section covers only those that are unique to this software.
Edit menu
- New
- Choose a new suboperator to add from the submenu. The suboperator is added in an empty area of the Data View window.
- Flip
- Reverses the connectors of the highlighted suboperators vertically, so that inputs are on the bottom and outputs are on top.
Select menu
- Select Outputs
- Selects all output-type suboperators, such as Output Custom and Output New.
Group menu
For details on the Group menu functions, see Grouping Suboperators.
Display menu
For details on the Display menu functions Description and Output Order, see Additional Controls.
Options menu
- Auto Update On Data View Close
- The option is related to the Auto Update option in the Data operator interface. When Auto Update is on, the changes in the suboperators of the operator or test are automatically applied to the particle system. When off, to apply the changes, click the Update button. When Auto Update is off, you can open Data View and modify the suboperators as long as you like, without the delays caused by the particle system recalculations. When you are done with editing the data flow in Data View, you can close it, and it will apply the changes automatically to the particle system, because the Auto Update On Data View Close option is on.
- Use Dynamic Names For New
- When on, the software uses dynamic naming for all new suboperators. This means that, when you add a new suboperator, the default name as shown on the suboperator in Data View is the most significant setting. So, for example, when you add an Object suboperator, by default it is named Closest Object By Pivot, because that's the default Object Property setting. If you then change the Object Property setting to Point Pivot, for example, the suboperator is renamed Point Pivot. This switch is on by default; if you turn it off, each newly added suboperator is named with its type and a three-digit number (e.g., Object 002).
- Convert All To Dynamic Names
- Forces every suboperator to be named after its most significant setting.
- Convert All To Custom Names
- Forces every suboperator to be named with the name given it with Rename. If it was not renamed, its name is the suboperator type and a two-digit number.
- Save Preferences
- Saves the current layout and options as the default configuration. You're prompted to confirm this command.
Right-Click menu
Most of the functions in the Data View right-click menu are the same as in Particle View. For details, see Event Display Right-Click Menu.