In this exercise, you learn some basic controls for the Histogram to assist in tonal adjustments.
Tonal adjustment is one of several features that use the Histogram. The Histogram is especially useful in identifying and correcting tonal problems with images. The preview window shows the effects of making adjustments and may be used in conjunction with or instead of the histogram.
Related Exercises
Before doing this exercise, ensure that AutoCAD Raster Design toolset options are set as described in the exercise Exercise A1: Setting AutoCAD Raster Design Toolset Options.
Exercise
- In the ..\Program Files\Autodesk\ApplicationPlugins\RasterDesign2022.Bundle\Contents\Tutorials\Tutorial8 folder, open the drawing file TonalAdjustment01.dwg.
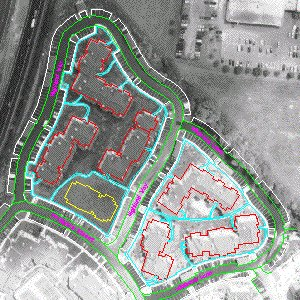
- View the vector line work in the drawing. The red lines represent the footprints of existing buildings in the project. The yellow outline is the building proposed for the project and is the reason the aerial photography is being introduced. Light gray lines represent the edge of pavement, cyan lines are boundaries of concrete walks, and green lines are parking areas.
Choose an image to insert
- To display the
Insert Image dialog box, click
Raster
 Insert.
- From the Files of Type list, choose All Image Files.
- If necessary, navigate to the \Tutorial8 folder.
- Select the image file
SiteAerial01.tif.
Insert the image using Quick Insert
- In the Insert Options area, select Quick Insert. Ensure that Show Frames Only and Zoom to Image are not selected.
- Click
Open to insert the image.
The image was pre-correlated and is properly scaled for the project.
If necessary, use REGEN to ensure the vector information is displayed on top of the image.
Note the extreme difference in shading between the lower right and upper left portions of the project. Leaving it this way would detract from the project presentation, and obtaining replacement photographs may be cost prohibitive. Our goal is to use Tonal Adjustment to make the tone as consistent as possible over the entire photo.

Compare histograms for the two areas
- Click
Raster menu
 Image Processing
 Histogram. Enter
e (Existing) to indicate that you will use an existing closed vector entity to define a sub-region for analysis.
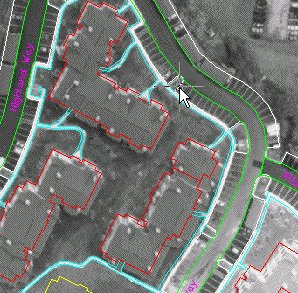
- Pick a point on the edge of pavement (light gray) line that completely surrounds the buildings in the upper left. The histogram will evaluate the image tone in this region.

- In the
Histogram dialog box, click the
Tonal Adjustment tab. Note the appearance of the histogram for this area of the image.
The histogram graphically shows the number of pixels in the area that have each level of gray. In this case, we see a high frequency of midrange values, and a few at the right end that are very close to white. There are not too many pixels in this area that are very light (washed out) or very dark (shadowy). The visual appearance of this area is reasonably good.

- Click Cancel to close the Histogram dialog box, making a mental note of its general appearance.
- Click
Raster menu
 Image Processing
 Histogram. Enter
e (Existing).
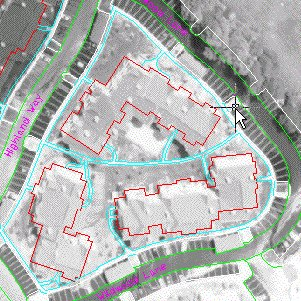
- Pick a point on the edge of pavement (light gray) line in the lower right area to define another region for analysis.
The following example shows where to select the point at the edge of the pavement.

- In the
Histogram dialog box, select the
Tonal Adjustment tab.
Note that the histogram is skewed, showing a high frequency of light gray and white. In the next exercise, we will modify the tonal balance in this part of the image, making it look as similar to the upper left section as possible. This means we need to make adjustments that effectively slide these high frequency values toward the left middle values. Note the secondary peak on the right which is more pronounced than the one contained on the upper left portion histogram. This peak represents the lighter colors of the building fronts which show more in the lower right portion of the project. We should perform the adjustment so that the peak is preserved, although it may be modified in appearance.

- Click Cancel to close the Histogram dialog box.
- Close the drawing without saving changes.