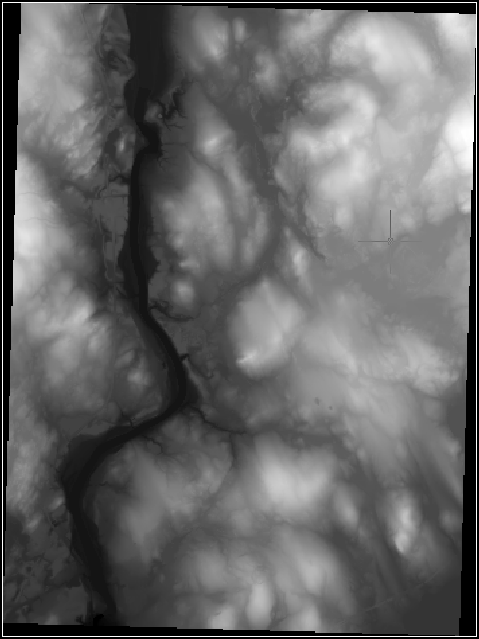
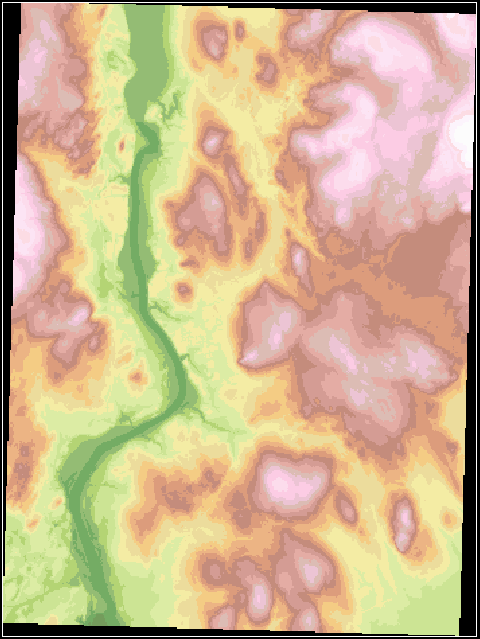
In this exercise you display data from a digital elevation model (DEM).
DEM files make use of a palette color map, which is very versatile. This type of color map uses a palette of colors in which each color represents a range of values. The values can be surface elevation, slope, or aspect (slope direction). Each color can represent an equal range of values, or the ranges can be calculated using a formula for quantile or standard deviation distribution.
A quantile distribution assigns an equal number of values to each range (color), and adjusts the range spread accordingly. If your land surface has a majority of data values clustered around a subset of the full range, the individual ranges for that subset will be narrower to show that area in greater detail.
A standard deviation distribution sets the spread of each range equal to one standard deviation for the full set of data values in the file. The center six ranges of the palette cover the spread of values in the file. If the image has a set of values that approximate a normal distribution, the third and fourth ranges together represent about 68% of the full range. The dividing line between these two center ranges is the arithmetic mean value of the data set.
While palette color maps are complex, they can also be saved for ease of reuse with other files, including DEM and 16-bit integer formats.
In this exercise you will import an existing palette, located in the folder \Tutorial5.
The palette color map includes additional controls not covered in this exercise.
Related Exercises
Before doing this exercise, you should ensure that AutoCAD Raster Design toolset options are set as described in the exercise Exercise A1: Setting AutoCAD Raster Design Toolset Options.
Exercise
- Open a new drawing or use the default Drawing1.dwg.
Insert a DEM image
- Click
Raster menu
 Insert.
- In the Insert Image Dialog Box, select \Tutorial5\Manchester_North_map.dem.
- In the Insert Options area, click Insertion Wizard, then click Open.
- On the
Assign Color Map tab, click
Next, click
Next on the other tabs, then click
Finish on the
Insertion tab.
The DEM image is inserted in the drawing, using the default palette color map.
- If the Image Manager Toolspace is not open, to open it, click
Raster menu
 Manage.
- If the image is not clearly visible, then in the
Image Manager toolspace,
Image Insertions view, right-click the image insertion name (Manchester_North_map) and select
Zoom To.
This view of the land surface shows elevations in shades of gray.

In the next few steps we will examine the information contained in this color map and explore some other views of the same data file.
Edit the color map
- In the Image Manager toolspace, Image Insertions view, right-click the image insertion name and select Edit Color Map.
- On the
Palette Assignment Color Map Dialog Box, click
 to create a new color map.
- In the Palette Color Map Definition dialog box, examine the
Range Table to understand the current map display.
By using the scroll bar on the far right of the dialog box, you can see that the palette has 256 color ranges defined. The Range Spread column shows that each color represents an elevation range of about 2.4 feet. The Range Upper Value column shows you that the elevations in the image range from 732 feet down to 126 feet (128.3765 minus 2.3765).
Note: You can verify the elevation units and range for this image on the Image Data view of Image Manager: click Elevation, then click the image data band (FLT:32-bit) to see its properties.The Data Interpretation setting (on the left side of the Palette Color Map Definition dialog box) shows you that the image displays Value rather than surface height, slope, or aspect (slope direction). The Value Distribution setting shows you that the palette colors represent equal ranges that are calculated mathematically (parametric) rather than set manually.
- Change the
Data Interpretation setting to
Height (US survey feet). This setting reflects the actual values in the image data, so the range values do not change.
Further exploration: Change the Data Interpretation setting to Height (meters), and you immediately see the values in the Range Table converted to meters. Select other Data Interpretation options, and in each case, the range values change to show the new interpretation.
In the next few steps we will create a new color map that uses a smaller number of data ranges.
- In the Palette area of the Palette Color Map Definition dialog box, click Import.
- In the Import Palette Dialog Box, browse to \Tutorial5.
- Select the palette file
USGS National Map.pf and click
Open. The palette is brought into the
Palette Color Map Definition dialog box.
The Range Table automatically adjusts to the new palette, so the elevation range is spread equally across 22 colors.
- In the Color Map Name field in the upper left of the dialog box, enter the name USGS-E Color Map, then click OK to save the color map.
- In the
Palette Assignment Color Map dialog box, click
Apply. The new color map is applied to the display.

In the next few steps we will change the color map to use a quantile distribution of ranges.
Create a quantile color map
- In the
Palette Assignment Color Map dialog box, click
 to create a new color map.
- In the
Palette Color Map Definition dialog box, in the
Value Distribution area, click the menu and select
Quantile.
The Range Table automatically adjusts to the elevation data, allocating an equal number of data points to each range. As a result, the elevation spread for each range is variable. Around elevations of 300–325 feet and 415–440 feet, we see narrow ranges, indicating a relatively large number of readings in these ranges. Around 575–732 feet, the ranges are wide, indicating fewer instances of these elevations.
- In the Color Map Name field in the upper left of the dialog box, enter the name USGS-Q Color Map, then click OK to save the color map.
- In the Palette Assignment Color Map dialog box, click Apply. The new color map is applied to the display.
- In the
Color Map Name area of this dialog box, select
USGS-E Color Map and click
Apply to revert to the first color map you created.
The controls in this dialog box allow you to easily compare the effects of different color maps.
Create a hillshading color map
- In the
Palette Assignment Color Map dialog box, click
 to create a new color map.
- In the
Palette Color Map Definition dialog box, in the
Range Table area, select the entire range as follows:
- In the Index column, click 0 to select the bottom row
- Use the scroll bar on the right to scroll to the top row
- Hold down the Shift key and click index
- Right-click within the range table and select Assign Color.
- In the Select Color dialog box, on the True Color tab, ensure that the Color Model setting is HSL.
- In the Color field in the lower left, enter 150,150,150, or use the vertical Luminance slider to select a similar light gray tone.
- Click
OK to return to the
Palette Color Map Definition dialog box.
In the Range Table, note that all of the ranges are set to the gray tone you selected.
- In the Display Enhancements area, select Hillshade, then set the Vertical Exaggeration factor to 5.
- In the Color Map Name field in the upper left of the dialog box, enter the name Gray-5 Color Map, then click OK to save the color map.
- In the
Palette Assignment Color Map dialog box, click
Apply.
This color map exaggerates the topographic relief of the surface and simulates a light source in the upper left to cast shadows on the terrain.
Further exploration: Return to the Palette Color Map Definition dialog box and create more color maps that
- use Standard Deviation value distribution (import palette Std-Dev-6.pf for this one)
- display surface slope
- display surface aspect
Tip: If you want to discard all unused palette color maps from your drawing, enter ipurgecm on the command line. - Save or discard your drawing, as you prefer.