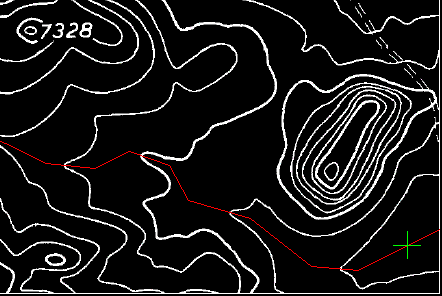
In this exercise, you follow along a path defined by vector, stopping along the way to enter elevations.
The 3D polyline follower differs from other followers in that it does not attempt to digitize existing raster. The decision points for this follower can be either vertices in the path or raster impact points. At each decision point, elevation information is requested. You can do this in three ways:
- Enter the elevation explicitly
- Assign the elevation automatically based on an increment or intersection with vector data
- Interpolate the elevation between known points
Related Exercises
Exercise
- In the \Tutorial6 folder, open the drawing file
VTools_07.dwg.
Access the Raster Design Options dialog box
- To display the
Raster Design Options dialog box, click
Raster
 Options.
- Click the
VTools Follower tab. In the
3D Polyline Settings area, change the
Elevation Interval to 20; ensure that the options
Use Raster Impact Points Only and
Ignore Raster Speckles are both cleared.
These settings control how the new vector line is created and the default elevations used when raster contours are encountered. All vertices and raster impact points along the existing vector polyline will be used for the new 3D breakline.
- Click
OK to exit the
Raster Design Options dialog box.
Create a 3D breakline
- To create a breakline of the stream bed, click
Raster menu
 Vectorization Tools
 3D Polyline Follower.
- Enter v (Vector) to use the existing vector 2D polyline.
- Select the existing polyline near the right end.

The cursor is positioned at the right end of the polyline, waiting for you to specify an elevation.
- Enter 7155 for the first elevation. The cursor moves to the next vertex of the polyline.
- Enter i (Interpolate) to interpolate the elevation of the polyline vertex.
- Enter 7160 to set the elevation for the next point, near the intersection with the raster contour.
- For the rest of the vertices except the last endpoint, use
i to interpolate elevations where there is no raster data, and press
Enter to accept the elevation calculated by the program where raster and vector intersect.
Watch the command line to see the elevations being used by the routine. If the elevation is zero, it is a polyline vertex and you should use the interpolation option to calculate an elevation for that point. If there is an elevation displayed at the command line, the point is an intersection between raster and vector and the program is using the interval set in the options to determine the elevation at that point. You can enter known elevations at any time.
- When you reach the end of the polyline, enter
7342 to specify the elevation at the end of the breakline.
There is a new 3D polyline drawn on the current layer. If you list this polyline, you can see that each vertex has an elevation. Several of the vertices have interpolated elevations, while the rest are even elevations where the raster contours intersect the original polyline path.

- Select the 3D polyline and enter the
LIST command.
The system displays the coordinates of each vertex, with elevations shown as Z values.
- Close the drawing without saving changes.