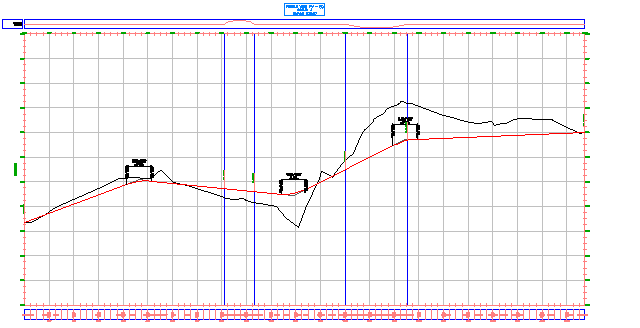
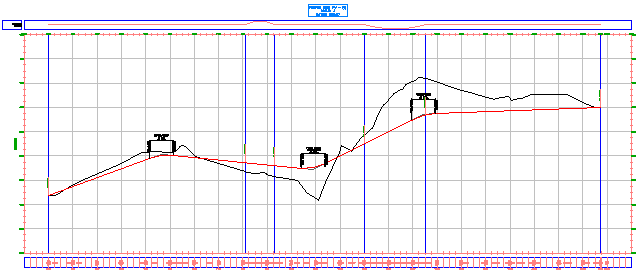
In this exercise, you will learn how to change the data displayed in a profile view.
You use the Profile View Style dialog box to define profile view styles that control the format for titles, axis annotation, and other elements of a profile view.
The Profile View Properties dialog box is the central location in which you can modify all components of the profile view, including profiles, labels, styles, and data bands.
You can also do some common editing tasks, such as deleting profiles or modifying profile labels, within the drawing window by right-clicking the appropriate object.
Change the profile view style
- Open Profile-5A.dwg, which is located in the tutorials drawings folder.
- Click the grid to select profile view profile view PV- (1). Right-click. Click .
- Click the Information tab.
- In the Object Style field, change the profile view style to Major Grids. Click Apply.
Notice that this style change affects the X-axis annotation as well as the grid.
- Click
 Edit Current Selection.
 - In the Profile View Style dialog box, examine the contents of the various tabs to see the many settings that can be included in a style definition.
For example, on the Title Annotation tab, you can change the format and location of the profile view title. On the Display tab, you can turn various parts of the profile view on and off.
- Click Cancel, and then click OK to close the dialog box.
- Zoom out so you can see both profile views.
When you applied the Major Grids style, which includes grid padding above and below the profile, PV- (1) enlarged to overlap PV- (2).
- Click PV- (2) and move it up above the title block for PV- (1).

Now you will edit the Major Grids profile view style to add consistent grid padding, clip the profile view grid, and modify the appearance of the ticks along the axis.
Modify the grid in the profile view style
- Click the PV - (1) grid to select the profile view. Right-click. Click .
- In the Profile View Style dialog box, on the Grid tab, under Grid Padding, change the padding of all four axes to 1.0000.
- Click Apply.
Notice that in the drawing, there is now one full major grid between the profiles and the profile view extents.

- Under Grid Options, select Clip Vertical Grid and Clip Horizontal Grid. Under both selections, select Omit Grid In Padding Areas.
Notice that the graphics in the dialog box change to demonstrate the effect the setting has on the profile view.
- Click Apply.
Notice that in the drawing, the profile view grid has been removed from above the surface profile and the padding area you specified.

The grid is clipped to the surface profile because the Clip Grid setting in the profile view properties for PV - (1) is set to the centerline surface profile. Setting the profile view style to Clip To Highest Profile(s) would override the property setting and clip the grid to the layout profile.
- Click OK. Note:
If the style changes have not been applied to the profile view, enter REGEN at the command line.
Modify the axis annotation in the profile view style
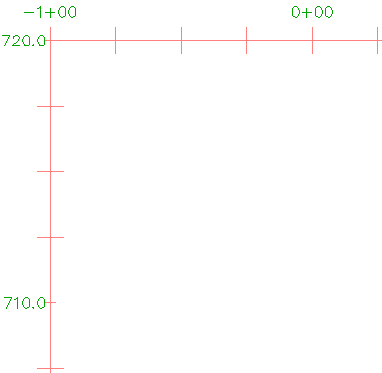
- Pan and zoom to see the upper left corner of the profile view grid. Zoom in so you can clearly see the tick marks on the horizontal and vertical axes.
Notice that the starting station labels overlap. In the next few steps, you will correct the overlap and modify the justification of the ticks at the major stations.

- Click the grid to select the profile view. Right-click. Click .
- In the Profile View Style dialog box, on the Horizontal Axes tab, click Top.
This control sets the focus of the controls on this tab to the top axis. If, after you have changed the top axis, you would like the changes to carry over to the bottom axis, select Bottom and repeat the changes.
Note:The bottom axis controls the major and minor grid spacing.
- Under Major Tick Details, specify the following parameters:
- Tick Size: 0.2500
- Y Offset: 0.1000
- Click Apply.
The major ticks are longer, and the station labels move up.

- On the Vertical Axes tab, make sure Left is selected as the axis to control. Note:
The left axis controls the major and minor grid spacing.
- Under Major Tick Details, specify the following parameters:
- Tick Size: 0.2500
- X Offset: -0.1000
- Click OK.
The ticks are longer, and the elevation labels move to the left.

Further exploration: Experiment with the other settings in the Major Tick Details area. Make the same changes you made in the previous steps to the right axis.
To continue this tutorial, go to Exercise 2: Adding Hatch Patterns Between Profiles.