This tutorial demonstrates how to create and edit mass haul diagrams to display earthworks in profile.
Mass haul is defined as the volume of material multiplied by the distance it is moved during construction. A mass haul diagram consists of two objects: a mass haul line, and a mass haul view. The mass haul line represents the free haul and overhaul volumes in cut and fill conditions along an alignment. The mass haul view is the grid on which the mass haul line is drawn.
The middle axis of the mass haul view is known as the balance line. The location of the mass haul line relative to the balance line indicates material movement in the current design. When the mass haul line rises above the balance line, it indicates a region in which material is cut. When the mass haul line falls below the balance line, it indicates a region in which material is fill.
There are two methods to compare free haul volume and overhaul volume:
Grade Points
Grade points are stations at which the proposed project design transitions from cut to fill. In a mass haul diagram, a grade point is the highest or lowest point in a mass haul region. A grade point is the highest point in a mass haul region where the profile transitions from a cut condition to a fill condition. A grade point is the lowest point in a mass haul region where the profile transitions from a fill condition to a cut condition.
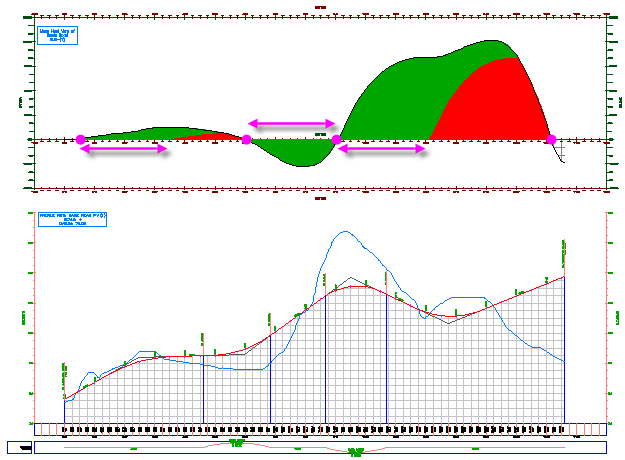
In the grade points method of measuring free haul, a horizontal line that is the length of the specified free haul distance is drawn. The line is positioned so that it is both parallel to the balance line and touches the mass haul line. The volume that is enclosed in the area formed by this line and the mass haul line is free haul.
In the following image, the green areas are free haul volume, and the red areas are overhaul volume. The magenta circles and arrows indicate the grade points on the mass haul line and profile. The vertical magenta lines illustrate the relationship between the mass haul line and profile in the grade point balancing method.

Balance Points
Balance points are the stations at which the net cut and fill volumes are equal. In a mass haul diagram, the balance points are located on the balance line, where the net volume is zero. In the balance points method of measuring free haul, the mass haul line is duplicated and shifted horizontally to the right (where the project transitions from cut to fill) or to the left (where the project transitions from fill to cut) by the free haul distance.
In the following image, the green areas are free haul volume, and the red areas are overhaul. The arrows illustrate the free haul distance in cut and fill conditions.
