You can use the Tool Load dialog to show a graph of the estimated horsepower load on the tool during 3d simulation. You can use these estimates to fine-tune the program to improve performance.
Note: The horsepower values are estimates. If you are approaching the power limits of your machine, you should lower your feed rates, or decrease the width or depth of your cuts.
To show the tool load:
- Select Home tab > Simulation panel > Show > Tool Load.
- Run a 3D simulation. The
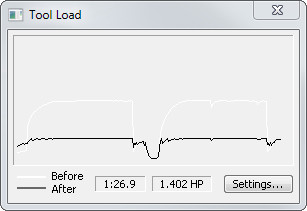
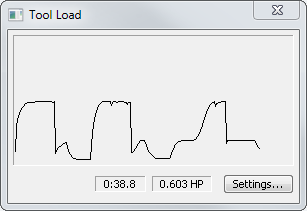
Tool Load dialog displays a graph of the simulation time and the load on the tool. The current simulation time and tool load are displayed below the graph.
- Click Settings to display the Power Settings dialog.
- Specify the settings in the
Power Settings dialog:
- Max. Power — This displays the maximum horsepower used so far. Display this dialog at the end of a simulation to see the maximum horsepower used in the entire program.
- Power Limit — Enter a maximum horsepower displayed in the Tool Load dialog.
- Pause simulation — Select this option to pause the simulation when the Power Limit value is exceeded.
- Show this dialog — Select this option to display the Power Settings when the Power Limit is exceeded.
- Clear — This clears the Max. Power value and clears the graph when the simulation resumes.
- Click OK to close the Power Settings dialog.
- Repeat the 3D simulation to show the graph using the updated settings.
Note: You can control the accuracy of the graph with the
Power graph: samples/min setting on the Options > Simulation > 2D/3D Shaded page.
If you have run a feed optimization, the Tool Load graph shows the optimized loads in black and the unoptimized loads in white: