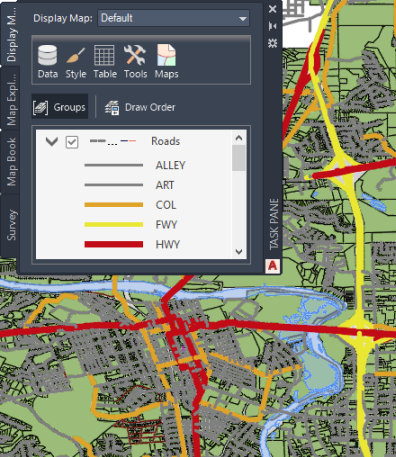
 Themes vary the display of features on the feature layer based on properties or attributes associated with that layer.
For example, a theme for a point layer might display retail store locations with a different symbol for each type of store. A polygon layer theme might display each land use classification with a different color or shading.

A theme showing roads themed by type
Theme Rules
A theme for a feature layer has a set of scale ranges and a rule that corresponds to each one. For example, if you are theming by parcel size, the scale ranges would indicate different parcel sizes. The first range might comprise parcels between 1000 square feet and 5000 square feet, the second range might comprise parcels 5001 square feet to 10,000 square feet, and so on. The first rule would describe how the first range appears on the map. For example, the smallest parcels might be lightest in color, and the colors might get darker as the parcel size goes up.
Rules can include a visual style, a legend label, and a feature label.
- Visual style options vary, depending on the type of geometry on the layer. Polygon style options include fill and border options; line style options include line thickness, color, and pattern; point style options include a symbol, size specifications, and color.
- Legend labels can provide a description of the condition of a rule. For example, you can edit the default legend label so it reads “Small parcels,” instead of “1000...2000.”
- Feature labels display the values of a property. For example, you can label parcels with their address or area values.
As a layer is drawn, each feature is compared to the rules in the order that they are listed. The first rule for which the feature meets the condition is used to specify the style and legend label for that feature. A default or empty condition applies to all features and defines the style for features that do not meet any of the preceding rules. A well-constructed theme contains only one default rule and it is last in the list.
Distribution Methods
When you create a range of conditions for a feature theme, you must specify the distribution method. The following methods are available:
| Method | Description |
|---|---|
| Equal | The difference between the high and low values is the same for every range. This method is easy to interpret and is useful for showing continuous data such as rainfall. |
| Standard Deviation | Features are placed in ranges based on how much their values vary from the mean. AutoCAD Map 3D toolset calculates the mean and then adds or subtracts the standard deviation to or from the mean to create the ranges. |
| Quantile | Each range contains an equal number of features. This method is useful for showing data in which values are evenly distributed. |
| Jenks (Natural Breaks) | Ranges are based on natural groupings of data values. Features with similar values are grouped. This method shows the natural groupings in the data. |
| Individual Values | Features are not grouped. This distribution is useful if values are not continuous, there is a fixed number of values, and many features have the same value. |