Provides access to the options used for plotting animation.
You can access this window by selecting Animation > Plot All Properties/Plot Selected Properties from the Animation menu or from the Animation drop-down menu in the Key Controls.
Plot On Frame
Turn on Activate Plot On Frame to resample the data based on the specified frame rate, and ensure that data is plotted on exact frames. Keyframes are set on each frame of the animation.
If your take does not start or end on an exact frame, samples are taken from the frame before the beginning or after the end of the take. Plotting starts and ends on the closest exact frame.
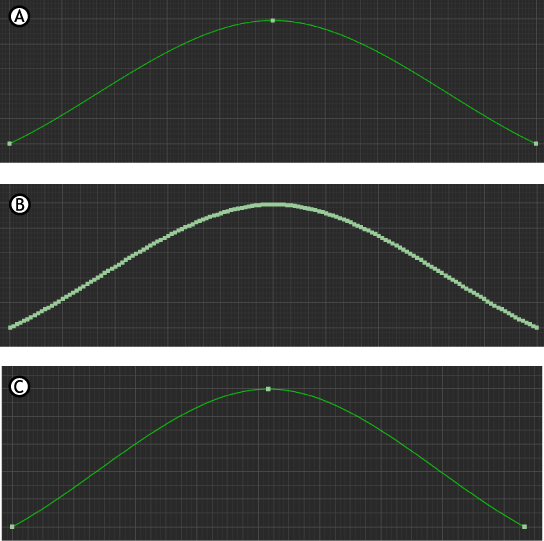
For example, in an animation curve displays before (A) and after (B) plotting when Plot On Frames was active. The Start time code is 0 and the End time code is 5. After plotting, the keyframes are set exactly on each frame in the animation.
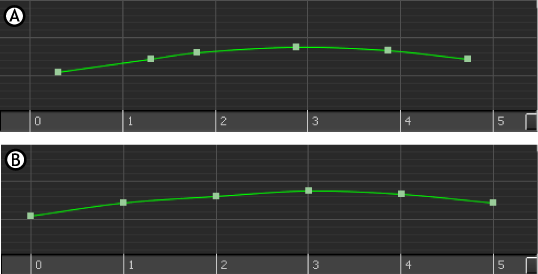
Plot on Frames A. Original curve before plotting B. Curve after plotting with Plot on Frame
Plot All Takes
Turn on to plot the data from all takes to a selected model. Plot all takes to your model if you intend to export the animation to other software. After you plot your data, you can disable its constraints.
When Plot All Takes is off, only the data from the current take is plotted to the selected model. For example, if you plot a take to a marker’s Translation properties on Take 3, the marker’s translation properties only contain function curves when Take 3 is the current take. If you switch to Take 2, the marker’s translation properties contain no function curves.
To plot the data from all takes, select the model to which you want to plot the animation, activate Plot All Takes, set other plotting options, and click Plot.
Plot Rate
Lets you specify what plot rate to use when plotting the take to a selected model. Plot rate is measured in frames per second (FPS). The number to the right of the Plot Rate menu shows the frames per second of the current take.
To select a preset plot rate, choose a preset plot rate between 23.97 and 120 FPS in the Plot Rate menu.
To set your own plot rate, select User FPS in the Plot Rate menu, drag in the number field, or double-click in the field and type the frame rate number you want to use.
Filters to Apply area
Lets you to select filters to apply when plotting. The Unroll and Constant Key Reducer filters are applied by default.
Rotation Filter
Lets you to select a filtering option for rotation animation, including compensating for gimbal locking and Euler rotation.
- Gimbal Killer
-
Select the Gimbal Killer option to compensate for gimbal locking effects by adding additional keyframes to your rotation function curves. These additional keyframes compensate for sudden flipping or shaking caused by the interpolation between keyframes during large rotational changes. Gimbal lock is most often encountered when you plot animation onto the skeleton of your model.
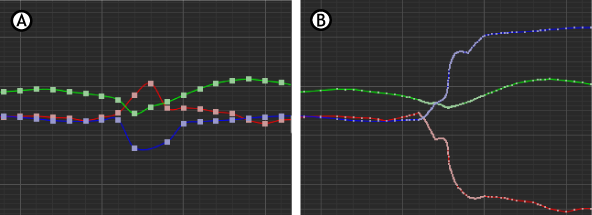
Gimbal Killer A. Original curves B. Gimbal Killer applied
- Unroll
-
Select the Unroll option to unroll equivalent Euler rotations, making the curves continuous.
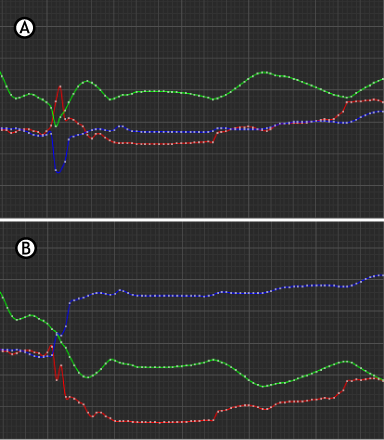
Unroll A. Original curves B. Unroll applied
Constant Key Reducer
Reduces the number of keyframes by eliminating redundant keyframes. Reducing the number of keyframes reduces the file size. This filter is active by default.
For example, the following figure shows a function curve before (A) and after (B) the Constant Key Reducer filter is applied, reducing the number of redundant keyframes used by the function curve.
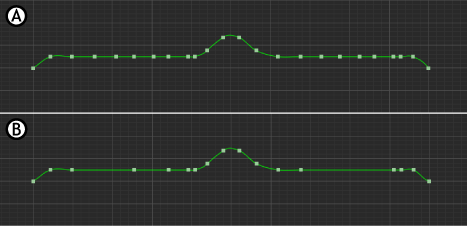
Constant key reducer A. Original curve B. Constant Key applied
For more information about filters, see Filtering.
Keep At Least One Keyframe
Lets you retain at least one keyframe when the Constant Key Reducer option is active. When your animation contains keyframes that have the same value, using the Constant Key Reducer may remove all of these keyframes. Enabling the Keep At Least One Keyframe option prevents this from happening.
Smart Plot
Lets you plot keyframe animation without adding extra keyframes. For example, this option is useful when you want to merge the keyframes you set on many layers. Using Smart Plot, you can merge the keyframe layers without adding more keyframes, letting you continue to edit your original keyframe animation easily.
For example, plotting a function curve that has three keyframes without using Smart Plot creates many keyframes, which are too numerous to edit easily. However, when plotted using Smart Plot, the resulting animation still has only three keyframes.
Keyframe animation A. Original keyframes B. Keyframes plotted without Smart Plot C. Keyframes plotted with Smart Plot
Increase Fidelity
Lets you add the number of keyframes necessary to keep your original animation. Keyframes are added to the three curves (translation, rotation, and scaling) of each vector, making the plotted animation closer to the original animation.
There are some situations in which plotting using Smart Plot alone does not reproduce the original animation. In these cases, you can activate the Increase Fidelity option to add keyframes and correct the function curves.
For example, Cube_source rotates to the left, then upwards. Its animation consists of three keyframes at frames 0, 30, and 60.
Cube1 is connected to Cube_source by a Parent-Child constraint, and moves beside Cube_source in two arc-like movements. No keyframes are set on Cube1, only on Cube_source.
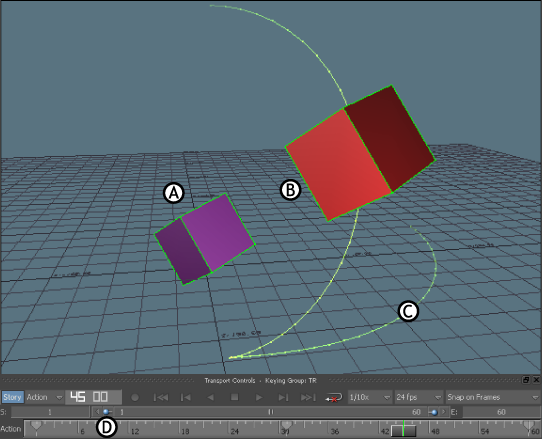
Animation using a Parent-Child constraint A. Cube_source B. Cube1 C. Cube1’s curved animation trajectoryD. Keyframes set on Cube_source at frames 0, 30, and 60
If you plot this animation using Smart Plot without Increase Fidelity, the keyframes at frame 0, 30, and 60 are plotted to both cubes, but the animation’s trajectory changes (see B in the following figure) because Cube1 needs more keyframes to retain its original animation.
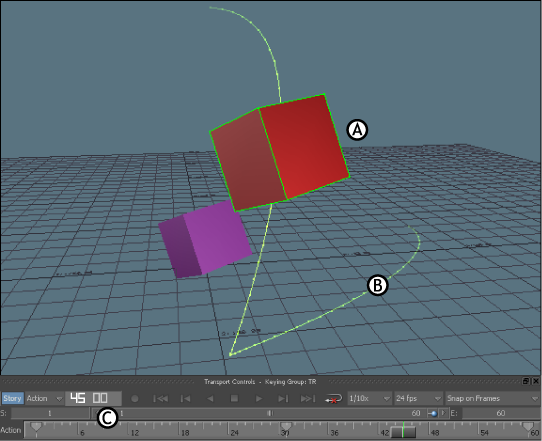
Animation plotted without Increase Fidelity A. Cube1 B. Cube1 trajectory altered C. Three few keyframes plotted to Cube1
If the Increase Fidelity option is active when the animation is plotted, keyframes with translation values are set to correct the function curve and retain the original animation (see B in the following figure).
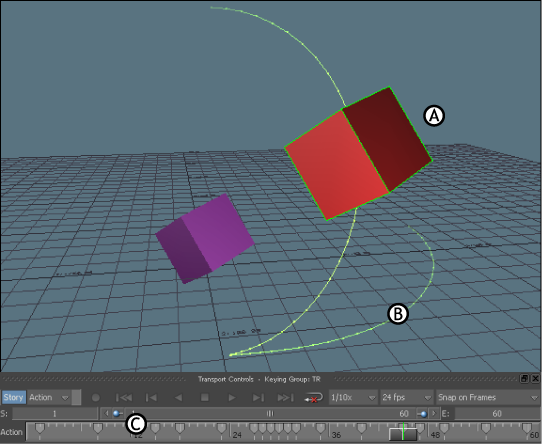
Animation plotted using Increase Fidelity A. Cube1 B. Cube1 trajectory similar to the original animation C. Keyframes plotted to Cube1 recreate original animation
To determine the number of keyframes that are set, use the Fidelity Keys Tolerance field.
Fidelity Keys Tolerance
Lets you determine the plotted animation’s accuracy compared to its original animation. Depending on the field’s value, extra keyframes are set to duplicate the original animation.
The value in the Fidelity Keys Tolerance field is a unit of measurement which represents how far, or to what degree, the plotted animation diverges from the original animation. The lower the field’s value is, the more keyframes are set when plotting, correcting differences between the original animation and the plotted animation.
For example, in the following figure, the Fidelity Keys Tolerance field is set to 0.25, which is the default setting. Plotting sets many keyframes to Cube1, recreating the original animation path. However, you may not want so many keyframes.
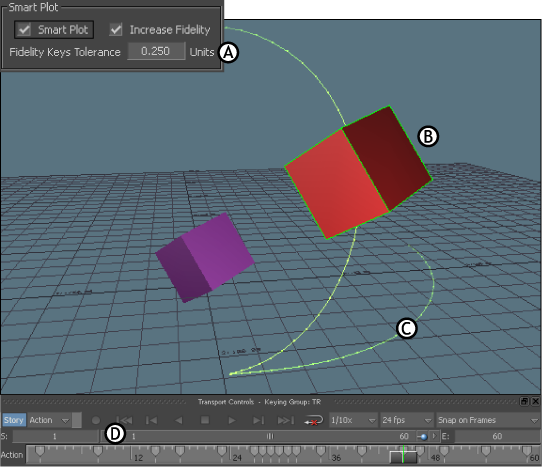
Plotting A. Fidelity Keys Tolerance field B. Cube1 C. Cube1 trajectory similar to the original animation D. Keyframes plotted to Cube1 recreate original animation
When the Fidelity Keys Tolerance field is set to a higher value, plotting sets fewer keyframes, but the animation path can change depending the number of keyframes.
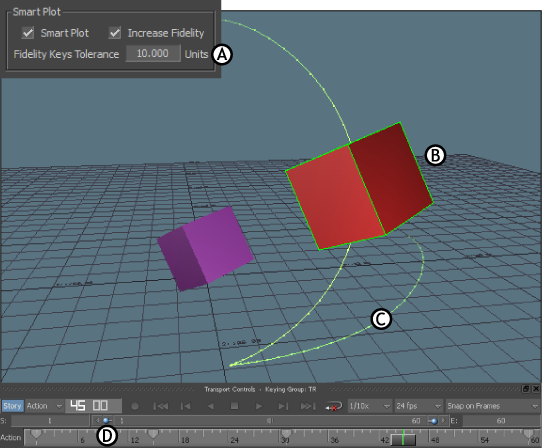
Plotting A. Fidelity Keys Tolerance field B. Cube1 C. Cube1 trajectory different than the original animation D. Five keyframes plotted to Cube1
You can also use the FCurves window to compare the animation. For example, compare the X-axis Rotation function curves of the animation shown in the following figure A and B.
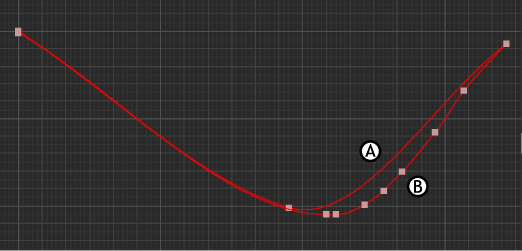
FCurves window A. Rotation function curve of Cube1 with Fidelity Keys Tolerance field set to default value (0.25)B. Rotation function curve of Cube1 with Fidelity Keys Tolerance field set to default value (10.0)
Plot Extensions
The Plot Extension option is available when you are plotting animation from the Control rig to the skeleton on a character that has a Character Extension. This option is only available when you plot the animation in the following ways:
- Clicking Plot Character in the Character Settings, then selecting Skeleton in the dialog box that follows
- Selecting
 > Bake(plot) > Bake (plot) To Skeleton >

When the Plot Extensions option is active, the animation on all Character Extensions is plotted along with the rest of the character’s animation. When the Plot Extensions option is disabled, Character Extension animation is not plotted.
If you plot animation using an option other than Plot Character, the option is grayed out and Character Extension animation is not plotted.
In the Story window, if you want to plot Character Extension animation to the current take (see Plot Whole Scene To Current Take), make sure that the Character Extensions option is selected in the Character track’s Body Parts menu before you plot (see Body Parts menu). If you do not want to include Character Extension animation, disable the option.
Precise Time Discontinuities
This option is available when the Story Mode is set to Edit and the Time Discontinuity option is activated in the Story window.
When active, Precise Time Discontinuities plots changes in data caused by shot discontinuity. See Edit Track list.
When the Story Mode is set to Edit, the Time Discontinuity option is active in the Story window, and you select an option to open a Plot window, a dialog box appears to warn you that you are about to plot animation that may be discontinuous. For more information on discontinuous animation and the Story window, see Edit Track list.
Plot Translation On Root Only option
This option is available after you click Plot Character in the Character settings and click Skeleton in the window that appears. You can also access the Plot Character option in the Edit menu of the Character Controls.
This option is also available when you click Plot Options in the Batch window.
Activate the Plot Translation on Root Only option to make sure that translation animation is plotted only to the Hips of the character.
Plot Aux Effectors
- Selecting
> Bake(plot) > Bake (plot) Skeleton >
This option is turned on by default. When turned off, this option prevents auxiliary effectors from snapping their position on to their related effectors when plotting/baking to the Control Rig.
Evaluate Deformation
When active, deformation is evaluated during the baking process. By default, this option is turned off to speed up baking.