The default results display for Cauchy stress shows stress along the X axis (XX).
In the Display panel of the ribbon, you can change the Component setting to display stress along the Y axis (YY), Z axis (ZZ), or shear stress along two axes (XY, YZ, or XZ).
In the Plot Settings dialog, you can change the display from Mapped to IsoSurface or Glyph.
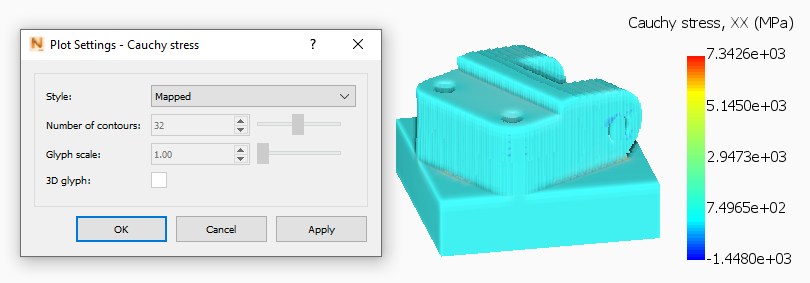
You can also select Warp by displacement in the Results Display panel, and set a Scale Factor greater than 1.00 to exaggerate the displacement.
The display of von Mises stress results is similar to that for Cauchy stress, but there are no Component options, and the display styles are limited to Mapped and IsoSurface.
In the display of Principal stress results, you can opt to display the Maximum, Intermediate, or Minimum range of values.
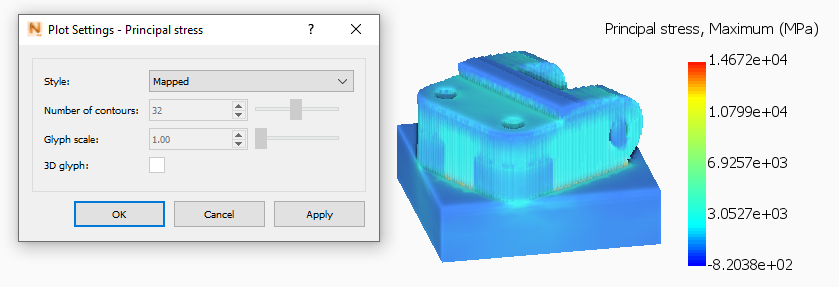
Display styles available in the Plot Settings dialog are limited to Mapped and IsoSurface.
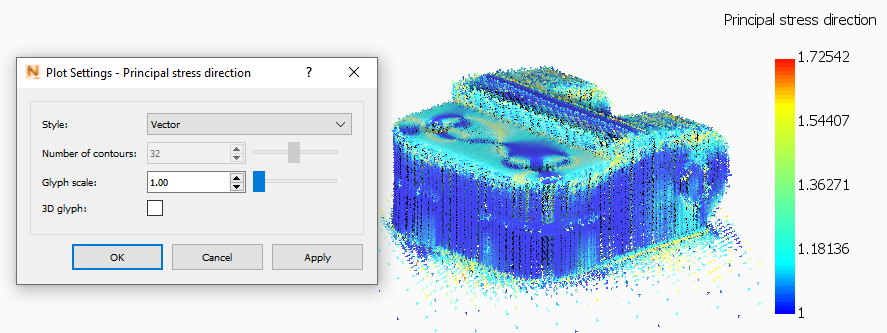
In the Principal stress direction display, The default display style is Vector, but you can also choose Mapped, or IsoSurface styles. With the Vector option, the Component setting is limited to the 1st Principal; if you select the Mapped or IsoSurface display style, you can choose to display the 1st, 2nd, or 3rd Principal.