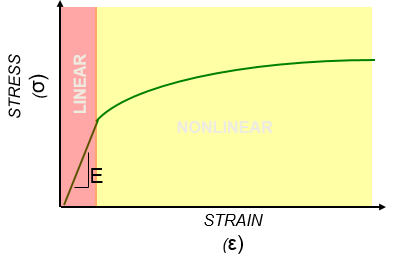
In a linear material model, the stress-strain relationship must be linear with a slope of E, Young’s Modulus (Hooke's law):

Material nonlinearity is a concern whenever the response at the operating loads causes strain levels in a material beyond the portion of the stress-strain curve that can reasonably be approximated as linear. Many materials have curves that deviate small amounts from linear for large amounts of strain so that, with all the other uncertainty in the model, there would be little value in a nonlinear material model. On the other hand, many curves deviate from linear almost immediately to such a degree that only the roughest trend studies can be made with a linear approximation.
The constant of proportionality in a linear material model is Young’s Modulus. This represents the slope of the linear portion of the stress-strain curve (see image below). For highly nonlinear materials, this modulus may only be applicable at very low strains.

Nonlinear material models of common engineering materials are defined by specifying their stress-strain curves. Most stress-strain curves represent only the tensile response. When a material has the same response in tension and compression, it is said to be symmetric. Cast iron is a good example of an asymmetric stress-strain behavior as it is stronger in compression than tension.
Types of Nonlinear Materials
There are several types of material nonlinearity that might be present in a structural analysis:
- Nonlinear elastic
- Bi-linear elasto-plastic
- Multi-linear plastic
- Hyperelastic
- Viscoelastic
Simplified models of stress-strain curves are shown below:

A nonlinear material model can be defined as nonlinear elastic where the part returns to a zero strain state when the load is removed, or elasto-plastic where permanent strain begins to accumulate after reaching the yield strength of the material.
Additionally, an elasto-plastic stress-strain curve can be input as bi-linear, where only an elastic modulus and a plasticity or hardening modulus are entered. It can also be defined as a multi-linear stress-stress curve where the true nonlinearity of the plastic range can be captured with a series of points.
Inventor Nastran allows the definition of two other nonlinear material models, hyperelastic, for rubber and other elastomeric materials, and viscoelastic, for time-dependent response such as creep. Each of these nonlinear material models requires more detailed knowledge of those phenomena as their behavior is not quite like common structural materials.
Stress-Strain Curves
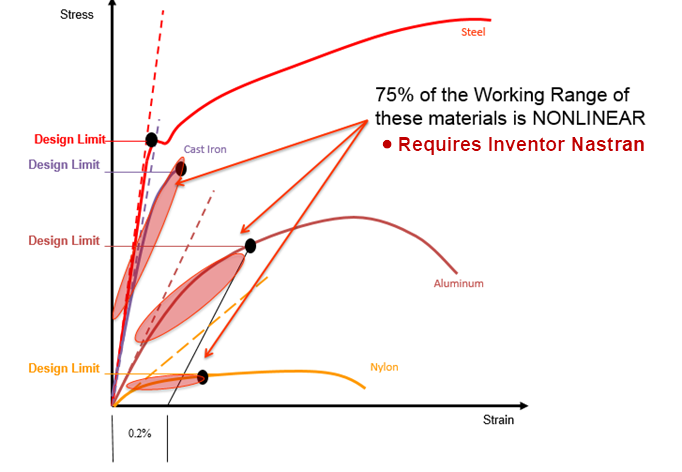
As you can see in the image below, nylon, aluminum and cast iron are materials with 75% of their working range in the nonlinear state. They require the use of an FEA program like Inventor Nastran to calculate the structural response to operating loads.

Stress-strain curves for metals are typically measured in tension or compression tests. The tensile test for metals is ASTM E8 and allows for multiple strain rates and material temperatures. The graphs below show stress-strain curves for 4340 Steel and 2024 Aluminum. You can see that the steel curves show a consistent slope, or Young’s Modulus until yield. The aluminum curve shows the variation in stress-strain response as different material orientations are examined. The curve also shows that 2024-T3 is asymmetric in that its tensile and compressive responses differ.
Both these curves were extracted from Mil Handbook 5H, a publicly available resource with a lot of good material reference data.

These curves below for Noryl, a GE Plastics PPO, were measured using ASTM D638, the standard tensile test for plastics. The curve on the left shows how the stress-strain relationship in plastics can vary with injection molding flow direction. The curves on the right show how the same material can have differing stress-strain responses at different strain, or loading, rates and temperatures.

From these brief examples, you can see how quickly a nonlinear material investigation can get very complex. Therefore, we recommend that you get the most applicable stress-strain data for the material you are using or considering to determine if material nonlinearity is even an issue for the strain levels you are operating in. This level can be determined from an initial linear material analysis. If you decide you need to use a nonlinear material model, try to find the curve that best represents your expected environment. Then, if necessary, bracket the results with 2-3 different curves to see how sensitive the response of interest is to this nonlinearity. If there is a difference and you can’t decide which material model is most correct, choose conservatively or back up your analysis with test data.
When post-processing results of a nonlinear material model, it is important to understand how the material yields on an element basis. Internal to each element are Gauss points where stresses and/or strains are calculated. For a nonlinear material, Nastran does a table lookup on the stress-strain curve for each Gauss point stress, then it reports an average of all Gauss points (which is the center stress) and extrapolates the Gauss point values to the corners.
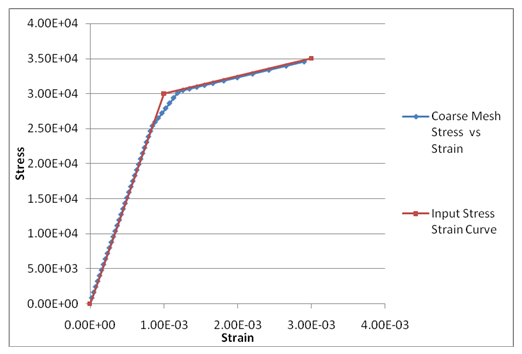
If an element undergoes a pure axial load, all Gauss points will yield at the same time, so the center stress will match the input stress-strain curve exactly. In the bending case, the outer Gauss points yield first then the inner points. This means the average center stress may not match the input stress-strain curve exactly during abrupt changes of slope on the input curve. This is because some Gauss points are on one point of the curve and the others are on another. If there is a large difference between the input stress-strain curve and the output stress results, a refined mesh is recommended.
The two images below show the stress-strain curves for two different mesh density. You can see how a finer mesh follows the input stress-strain curve more accurately.


It is also important to note that since the corner stresses are extrapolated from the Gauss points, their stress values can often exceed the stress values on the stress-strain curve. If there is a large difference between the center stress values and the corner stresses, it is recommended to refine the mesh to get a more accurate representation of the yielding that is occurring.
Note: NLMATSFACT in Autodesk Inventor Nastran is a stabilization technique used in nonlinear material analysis when abrupt stiffness changes occur in the material. It controls how the solver follows the stress-strain curve during iterations. This parameter can be set in the Parameters dialog box, under Nonlinear Solutions Processor Parameters (select the Advanced Settings checkbox first). The default AUTO setting automatically lowers the scale factor when it encounters divergence. A small value of NLMATSFACT (for instance .01) is more stable but requires more iterations per increment.
Guidelines
The following guidelines should be followed when building a nonlinear finite element analysis model with nonlinear materials:
- When performing an analysis that will have large amounts of strain, it is recommended to use a nonlinear elastic material.
- Check that the slope of your stress-strain curve (in the linear region) matches the Young’s Modulus of the material.
- Stress-strain data should be taken from a true stress-strain curve, not an engineering stress-strain curve. A true stress-strain curve takes into account the “necking” or reduction of cross-sectional area during a standard axial pull test. If the slope of the stress-strain curve is very “flat” (or negative) you may get a non-positive definite error during the analysis. If acceptable, remove the flat area on the stress-strain curve and re-run the analysis. If you must use a flat or negative slope stress-strain curve you can try and force a solution by turning SOLUTIONERROR=ON and FACTDIAG=0. Also, try setting NLMATSFACT to 0.1 – 0.5. These parameters can be set in the Parameters dialog box, under Solution Processor Parameters (select the Advanced Settings checkbox first).
- When using a nonlinear plastic material, it is recommended to use a stress-strain curve instead of the Bi-Linear method. The Bi-Linear method essentially creates a stress-strain curve with two different slopes. This abrupt change in the elastic modulus makes it more difficult to converge on a solution.
|
Previous Topic: Ball Impact Exrecise |
Next Topic: Flexural Test Fixture Exercise |