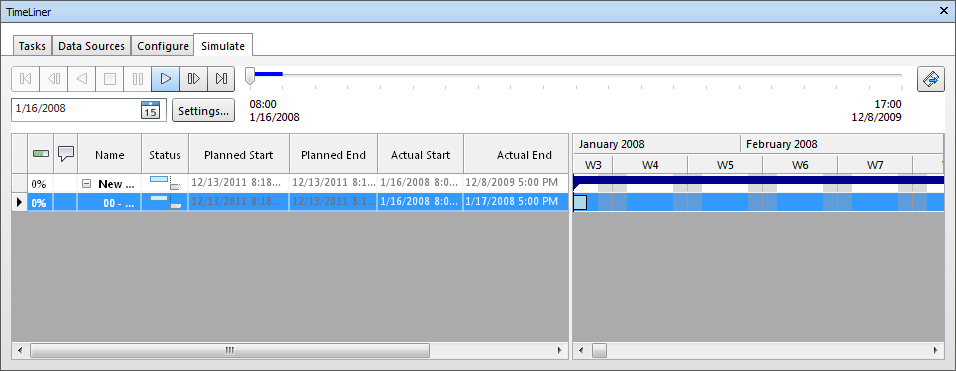
The Simulate tab enables you to simulate your TimeLiner sequence throughout the duration of the project schedule.
The Playback Controls
Use the standard VCR buttons to step and play forwards and backwards through the simulation:
Rewind ![]() will rewind the simulation back to the beginning.
will rewind the simulation back to the beginning.
Step Back ![]() will step back a single step size. See Simulation Settings Dialog Box for more information.
will step back a single step size. See Simulation Settings Dialog Box for more information.
Reverse Play ![]() will play the simulation backwards.
will play the simulation backwards.
Pause ![]() will pause the simulation at the time you press it at. You can then look around and interrogate the model, or step forwards and backwards through the simulation. To continue playing from where you paused, just press Play again.
will pause the simulation at the time you press it at. You can then look around and interrogate the model, or step forwards and backwards through the simulation. To continue playing from where you paused, just press Play again.
Stop ![]() will stop the simulation playing and rewind back to the beginning.
will stop the simulation playing and rewind back to the beginning.
Play ![]() will play the simulation from the currently selected time.
will play the simulation from the currently selected time.
Step Forwards ![]() will step forwards a single step size.
will step forwards a single step size.
Forward ![]() will fast forward the simulation to the end.
will fast forward the simulation to the end.
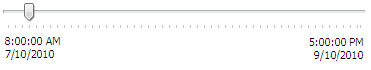
You can use the Simulation Position slider to quickly move forwards and backwards through the simulation. Full left is at the beginning and full right is at the end.
The Date/Time box next to the VCR buttons shows the point in time through the simulation. You can click on the drop-down icon to the right of the date to display a calendar, from which you can select a date to 'jump' to.
The Export Animation Button
The Export Animation button  opens the Animation Export Dialog Box that enables you to export a TimeLiner animation to an AVI file or a sequence of image files.
The Settings Button
The Settings button opens the Simulation Settings Dialog Box that enables you to define how the schedule is simulated.
The Task View
All active tasks are show in a multi-column table. You can move and resize table columns, if necessary.
You can view the current simulation time for each of the active tasks, and how close to completion they are (Progress is displayed as a percentage). The Status of each active task is also displayed as an icon. For simulations where Planned and Actual dates are available, the status provides a visual representation as to whether there is any variance between the planned and actual dates. See The Status Icons for more information.
The Gantt Chart View
The Gantt Chart displays a colored bar chart illustrating your project status. Each task takes up one row. The horizontal axis represents the time span of the project, broken down into increments (such as days, weeks, months, and years) and the vertical axis represents the project tasks. Tasks can run sequentially, in parallel, or overlapping.
The visible range (zoom) level is determined by the Interval Size options in the Simulation Settings Dialog Box.