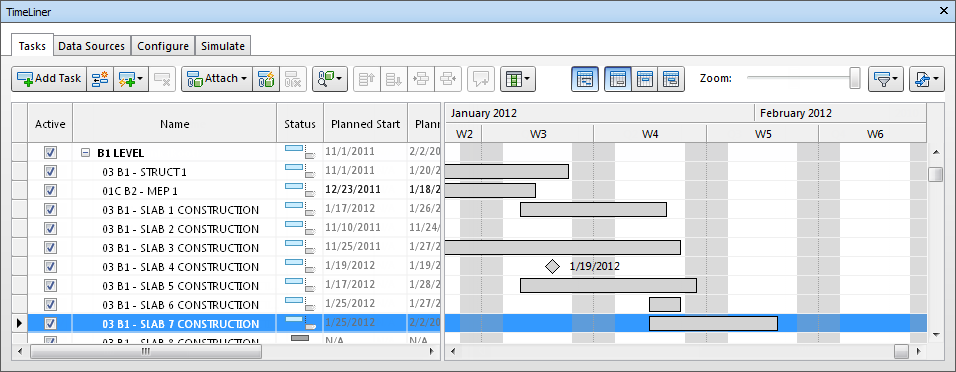
The Tasks tab enables you to create and manage project tasks. It shows all of the tasks in your schedule, listed in a table format. You can use the scroll bars at the right and at the bottom of the tab to move through the task records.
The Task View
The tasks are shown in a multi-column table, which provides some flexibility in how records are displayed. You can:
- Move or resize columns
- Sort column data in ascending or descending order
- Add new user columns to the default column set
- The Task Hierarchy
-
Autodesk Navisworks TimeLiner supports a hierarchical task structure, as imported from a data source, for example Microsoft Project™ (see the Data Sources Tab for more information). The hierarchy can be expanded or contracted by clicking on the plus or minus sign, respectively, to the left of the task.
- The Status Icons
-
Each task has its own status identified by an icon. Two separate bars are drawn for each task, showing planned against actual relationships. The color is used to differentiate the early (blue), on-time (green), late (red), and planned (gray) portions of the task. Dots mark the planned start and end dates.
Placing the mouse pointer over a Status icon shows a tooltip explaining the task status.
 Finished before planned start.
  Early start, early finish.
  Early start, on-time finish.
  Early start, late finish.
  On-time start, early finish.
  On-time start, on-time finish.
  On-time start, late finish.
  Late start, early finish.
  Late start, on-time finish.
  Late start, late finish.
  Started after planned finish.
  No comparison.
 - The Active Check Box
-
The check box in the Active column enables you to turn a task on/off. If a task is turned off, then it will not appear in the simulation. For hierarchical tasks, turning off the parent task will automatically turn off all child tasks.
- The Context Menus
-
Right-clicking within the tasks area on the tab, opens a context menu that enables you to work with tasks in your schedule.
- Copy Date/Time - copies date/time values in the selected field. This option is only available when you right-click one of the date fields (for example, Planned Start). Note: Currently, you cannot use the CTRL + C keyboard shortcut to copy date/time values.
- Paste Date/Time - pastes date/time values. To access this option you need to right-click one of the date fields. Also, this option is not available unless a valid date/time has been previously copied. Note: Currently, you cannot use the CTRL + V keyboard shortcut to copy date/time values.
- Enable Planned Dates - Simulate Planned Dates for the selected task. This option is available when you right-click the Planned Start or the Planned End field.
- Enable Actual Dates - Simulate Actual Dates for the selected task. This option is available when you right-click the Actual Start or the Actual End field.
- Dates - Enables you to simulate actual and planned dates for the selected task. If no dates are enabled for the task, then it will not appear in the simulation.
- Add Task - adds a new task to the schedule. This option is available when you right-click in an area of the task view below any current tasks.
- Attach Current Selection - attaches the currently selected items in the scene to the selected tasks.
- Attach Current Search - attaches all items selected by the current Search to the selected tasks. See Find Objects for more information on searching.
- Attach Set - attaches all items contained within a Selection Set, to the selected tasks. When you choose this option a list of all Selection and Search Sets saved in the current scene is displayed. Choose the Selection or Search Set you wish to attach to the tasks. See Create and Use Sets of Objects Use Sets of Objects for more information on using Selection and Search Sets.
- Append Current Selection - appends the currently selected items in the scene to the items already attached to the selected tasks.
- Clear Attachment - removes the attachment from this task.
- Add Comment - adds a comment to the task. See Use Comments, Markups, and Tags View Comments and Annotations for more information.
- Fill Down - sets the Task Type of all currently selected tasks in the Tasks view to match that of the task that is currently 'in focus'.
- Insert Task - inserts a new task above the one currently selected in the Task view.
- Delete Task - deletes the task currently selected in the Task view.
- Auto-Add Tasks - automatically adds a task for every topmost layer, top-most item, or every search and selection set.
- Find - finds items in a schedule based on the search criteria that you select in the Find menu. This option can be turned on/off in the Options Editor (Tools
 TimeLiner Enable Find check box).
You can use multi-selection (i.e. holding down SHIFT or CTRL) to perform most commands on several tasks at once. For example, should you need to delete all tasks, select the first task, then hold down SHIFT and select the last task, then press Delete.
- Copy Date/Time - copies date/time values in the selected field. This option is only available when you right-click one of the date fields (for example, Planned Start).
Tasks Buttons
- Add Task

- The Add Task button adds a new task as the bottom of the tasks list.
- Insert Task

- The Insert Task button inserts a new task above the one currently selected in the Task view.
- Auto-Add Tasks

- The Auto-Add Tasks button automatically adds a task for every topmost layer, top-most item, or every search and selection set.
- Delete Task

- The Delete Task button deletes the tasks currently selected in the Task view.
- Attach

- The Attach button enables you to:
- Attach Current Selection - attaches the currently selected items in the scene to the selected tasks.
- Attach Current Search - attaches all items selected by the current Search to the selected tasks. See Find Objects for more information on searching.
- Append Current Selection - appends the currently selected items in the scene to the items already attached to the selected tasks.
- Auto-Attach Using Rules

- The Auto-Attach Using Rules button opens the TimeLiner Rules Dialog Box where you can create, edit and apply rules for automatically attaching model geometry to tasks.
- Clear Attachment

- The Clear Attachment button detaches the model geometry from the selected tasks.
- Find Items

- The Find Items button enables you to find items in a schedule based on the search criteria that you select from the drop-down list. This option can be turned on/off in the Options Editor (Tools TimeLiner Enable Find check box).
- Move Up

- The Move Up button moves the selected tasks up the task list. Tasks can only move with their current level of hierarchy.
- Move Down

- The Move Down button moves the selected tasks down the task list. Tasks can only move with their current level of hierarchy.
- Indent

- The Indent button indents the selected tasks by one level in the task hierarchy.
- Outdent

- The Outdent button outdents the selected tasks by one level in the task hierarchy.
- Add Comment

- The Add Comment button adds a comment to the task. See Use Comments, Markups, and Tags View Comments and Annotations for more information.
- Columns

- The Columns button enables you choose one of three pre-defined column sets to display in the Tasks view; Basic, Standard or Extended. Alternatively you can create a customized column set in the Choose TimeLiner Columns Dialog Box by clicking Choose Columns, then selecting Custom when you have set up your preferred column set.
- Filter by Status

- The Filter by Status button enables you to filter tasks based on their status. Filtering a task temporarily hides the task from the Task and Gantt Chart views, but does not make any changes to the underlying data structure.
- Export Schedule

- The Export Schedule button enables you export a TimeLiner schedule as a CSV or Microsoft Project XML file.
The Gantt Chart View
The Gantt Chart displays a colored bar chart illustrating your project status. Each task takes up one row. The horizontal axis represents the time span of the project, broken down into increments (such as days, weeks, months, and years) and the vertical axis represents the project tasks. Tasks can run sequentially, in parallel, or overlapping.
You can drag a task to different dates, or click and drag on either end of the task to extend or shorten its duration. Any changes are automatically updated in the Task view.
Gantt Chart Buttons
- The Display Dates
- The Display Dates drop-down enables you to switch between Actual, Planned, and Planned vs Actual Gantt charts.
- Show/Hide Gantt Chart

- Click the Show/Hide Gantt Chart button to show or hide the Gantt chart.
- Show Planned Dates

- Click the Show Planned Dates button to show Planned Dates in the Gantt chart.
- Show Actual Dates

- Click the Show Actual Dates button to show Actual Dates in the Gantt chart.
- Show Planned vs Actual Dates

- Click the Show Planned vs Actual Dates button to show Planned vs Actual Dates in the Gantt chart.
- The Zoom Slider
- The Zoom slider enables you to adjust the resolution of the displayed Gantt chart. The utmost left position selects the smallest available increment in the timeline (for example, days); the utmost right position selects the largest available increment in the timeline (for example, years).
- Filter by Status
- The Filter by Status button enables you to filter tasks based on their status. Filtering a task temporarily hides the task from the Task and Gantt Chart views, but does not make any changes to the underlying data structure.
- Export Schedule
- The Export Schedule button enables you export a TimeLiner schedule as a CSV or Microsoft Project XML file.