To display curve deviations:
- Select one of the following:
- curves dependent on an object
- curves and the object
- Click Visualisation tab > Model panel > Analysis to display the Comparison Analysis dialog:
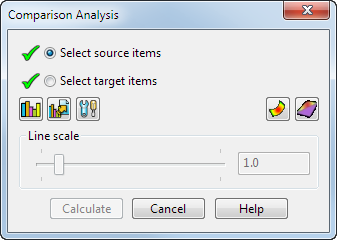
- Click the Curve Deviations
 button to display the deviations.
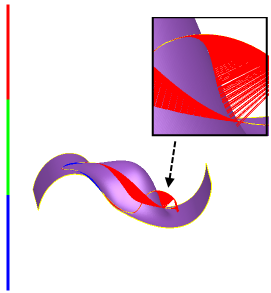
- Use the Line scale slider or enter a value in the box to specify the width of the curve deviation lines.Note: This option is only available if you have clicked the Curve Deviations button.
- Click the Curve Deviations button again to hide the curve deviation lines.