Use analysis display styles to visualize the results of an analysis generated by an add-in application.
Analysis display styles are permanently stored in Revit for use in project views. Within a view, you can select a different style and immediately apply it in the analysis result.
You can use the same following styles to display different results in different project views.
Colored surface
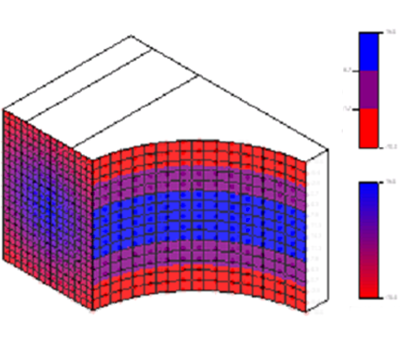 Displays analysis results as a colored surface. |
Markers with text
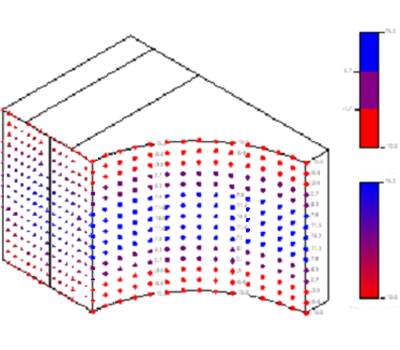 Displays a colored graphical shape at each data point. Each point has configurable corresponding numbers representing the analysis results. |
Diagrams with text
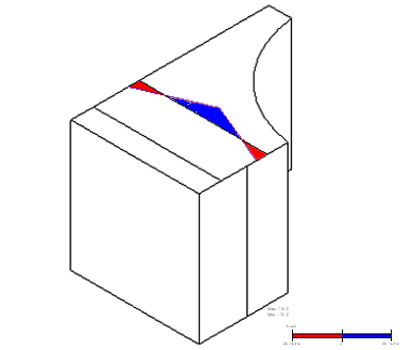 Displays a colored diagram generated from analysis data points. The diagram can contain fence lines drawn from the curve to the diagram boundary. Each point has configurable corresponding numbers representing the analysis results. |
Vectors with text
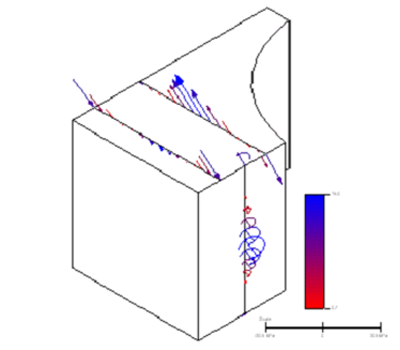 Displays colored vector arrows generated from analysis data points. The vector lines can be drawn to, from, and around data point axes. Each point has configurable corresponding numbers representing the analysis results. |
Deformed shape
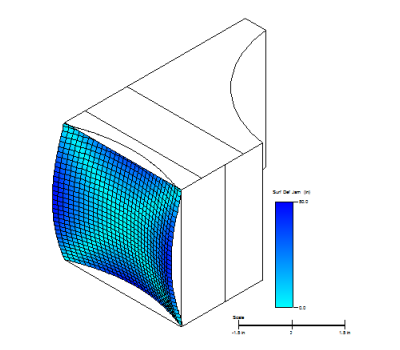 Displays the deformation of the analytical model. Deformation is described by a displacement vector at user-selected points on analytical surfaces and curves. |